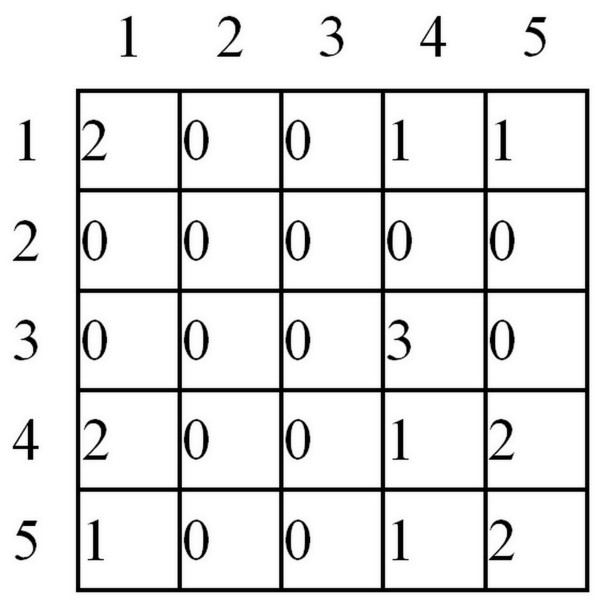
Figure 5.
LGLCMmatrix created based on theLSmatrix. The matrix presenting the total number of neighbourhoods between pixels. The number of neighbourhood is read selecting appropriate matrix column and row. For example, in row 3 and column 4 we read the value of 3. This means that on the image pixel 3 with the neighbouring pixel 4 occurred 3 times. All neighbourhoods (a total of 16) are calculated following this example. For this reason, the sum of the values in the matrix LGLCM is 16. It should be noted that further transformations of the matrix LGLCM are possible. They arise from the fact that the matrix LGLCM is symmetric to the neighborhood - if the value 3 is adjacent to the value 4, then the value 4 is adjacent to the value 3. For further analysis, however, a distribution of neighborhoods and the number of their occurrences are vital. The further away form the main diagonal the neighborhood is detected and marked in the matrix LGLCM, the greater contrast it has. The neighborhoods in the lower right corner of the matrix LGLCM refer to bright pixels whereas the ones in the upper left corner refer to dark pixels.

