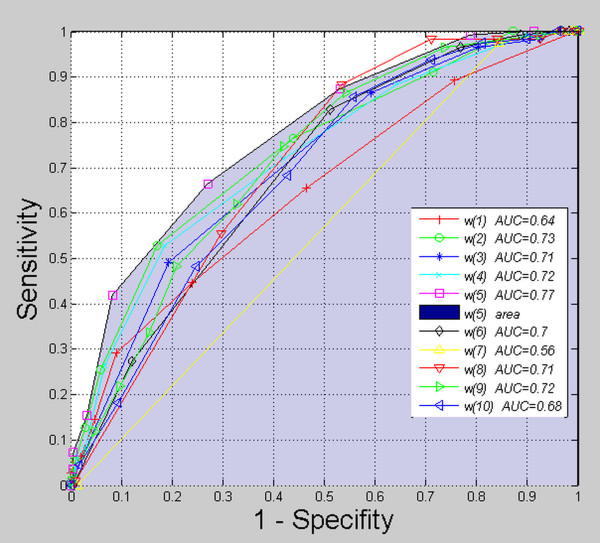
Figure 8.
ROCgraph (Receiver Operating Characteristics). The graph was obtained for all 376 images (29 healthy subjects and 65 patients with Hashimoto’s disease). The analysis concerns the impact on the result of each of the features w(1) to w(10) separately. The graph shows that the feature w(5), appearing alone as a criterion for the division of healthy and ill subjects, gives the best results. For this feature, the area under the ROC curve is 0.77. This graph only shows the impact of each feature ( w(1) to w(10)) on the efficiency of separation of healthy subjects from patients. It can be easily noticed that the obtained results are not very good. It will be proved further on that these results get better to a considerable extent when several features are taken into account simultaneously and the decision tree is created. Selection of the most representative features for the construction of the decision tree is the subject of further consideration.

