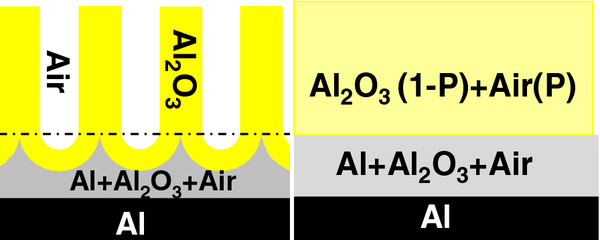
Figure 1.
Sketch of the structure used to model the ellipsometric data. Left: schematic drawing of the NAA structure showing the pores, the alumina, and the aluminum substrate. Right: the corresponding layered optical model considered by the characterization software. P is the porosity of the NAA, which corresponds to the volume fraction of air. The plus sign represents the use of a Bruggeman effective medium approximation to model the refractive index of the mixture of materials in the layer.

