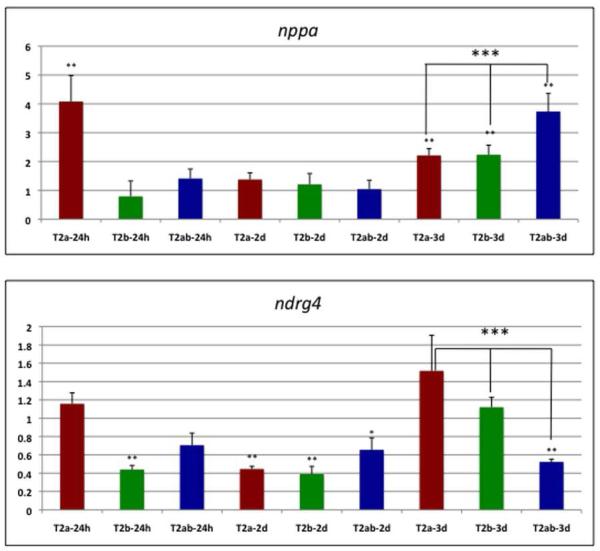
Fig. 11. Expression levels for nppa and ndrg4 are significantly altered at 3 dpf in double tbx2ab morphants compared to single morphants.
Shown are results from qPCR assays (n is at least 4 for each sample) for single tbx2a (T2a), tbx2b (T2b) or double tbx2ab (T2ab) morphants at 24 hpf (24h), 2 dpf (2d), or 3 dpf (3d), as indicated. Each sample was normalized to levels of transcripts derived from the 18s rRNA gene, and the average plotted relative to values obtained in control wildtype embryos (set at 1). The top panel shows quantification of nppa transcript levels, and the bottom panel shows measurements for ndrg4 transcripts. ** indicates that the nppa transcript values were significantly increased compared to wildtype for the tbx2a morphant at 24 hpf and for either single morphant and the double morphant at 3 dpf (p<0.01), and that ndrg4 transcript levels are significantly decreased compared to wildtype for the tbx2b morphant at 24 hpf, both single and double morphants at 2 dpf (* indicates p<0.05 for the double morphant), and only the double morphant at 3 dpf (p<0.01). Importantly, *** above the brackets indicates that at 3 dpf, the double morphant is significantly increased for nppa transcript levels compared to either single morphant, and significantly decreased for ndrg4 compared to the tbx2b morphant (p<0.05). Note that for the tbx2a single morphant there was more variation in ndrg4 transcript levels, but if anything they were higher, and are therefore clearly trending to the same conclusion (in this case p<0.08). Statistical significance was determined according to Student’s t-test.

