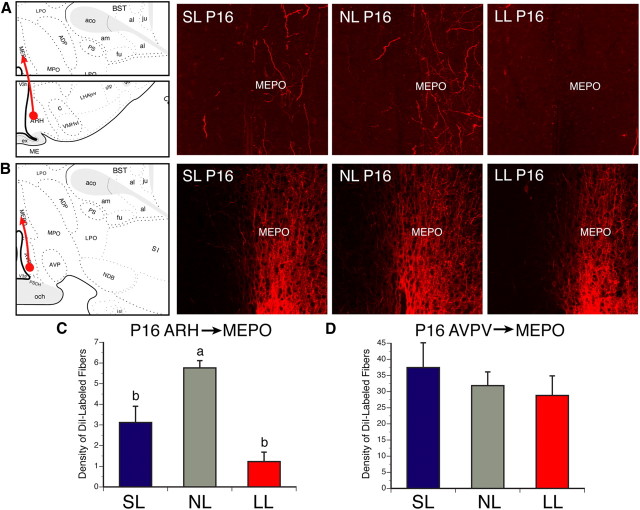
Figure 5.
A–D, ARH→MEPO and AVPV→MEPO axonal projections in postnatally overfed and underfed mice. Confocal images and quantification of ARH (A, C) and AVPV (B, D) fibers labeled with the anterograde tracer DiI and innervating the MEPO of P16 mice raised in SL, NL, and LL. V3, Third ventricle. p < 0.05, a vs b; n = 4–6 from 4 litters.

