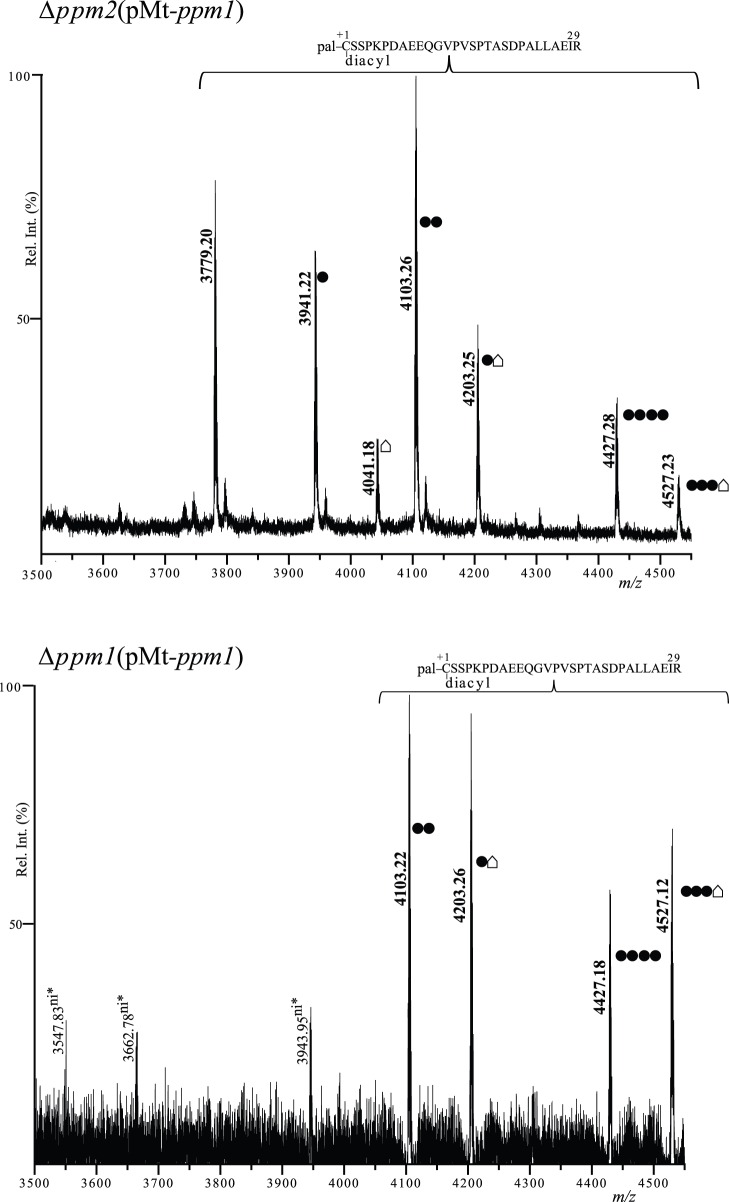
Figure 6. M. tuberculosis Ppm1 is active in C. glutamicum.
Comparison of MALDI PMF profiles of LppX protein purified from Δppm2 (pMt-ppm1) and Δppm1 (pMt-ppm1). The m/z 3500–4550 region of the mass spectra of LppX tryptic peptides after DDM/CHCl3-CH3OH treatment is shown and significant monoisotopic [M+H]+1 peaks are indicated. Upper spectrum: in the Δppm2 (pMt-ppm1) m/z peaks corresponding to different glycosylated forms of the triacylated LppX1–29 peptide were observed (m/z 3941.22, 4041.18, 4103.26, 4203.25, 4427.28 and 4527.23) as well as the peak of the non-glycosylated triacylated LppX1–29 peptide (m/z 3779.20) Bottom spectrum: in the Δppm1 (pMt-ppm1) strain, peaks corresponding to different glycosylated forms of the triacylated LppX1–29 peptide were observed (m/z 4103.22, 4203.26, 4427.18 and 4527.12, in bold). Three peaks (m/z 3547.83, 3662.78 and 3943.95) were detected but not identified. • = 1 hexose (Δm = 162 Da). • = unknown modification (Δm = 262 Da). “ni” means not identified and asterisks indicate that m/z assignments are not very accurate.

