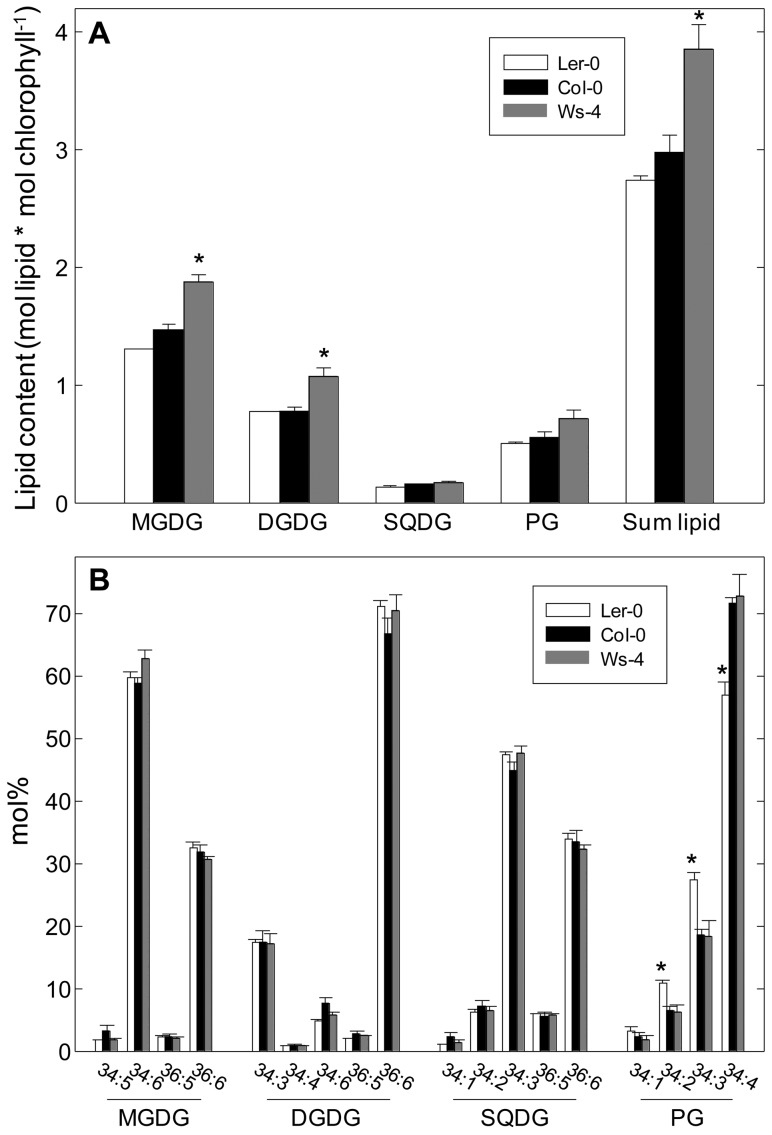
Figure 2. Thylakoid lipid composition in Col-0, Ws-4 and Ler-0 accessions.
Membrane lipids were extracted from plants grown on soil for six weeks and analyzed by LC-MS. (A) The content of each lipid class was expressed as a molar ratio to chlorophyll. (B) Lipid species comprising more than 2% of the lipid class are shown as mol % of the total lipid class. Numbers indicate total number of carbons and double bonds in lipid fatty acids. The plotted data represent means ±SD (n = 3). An asterisk indicates significant difference from Col-0 (Student's t-test P<0.05).

