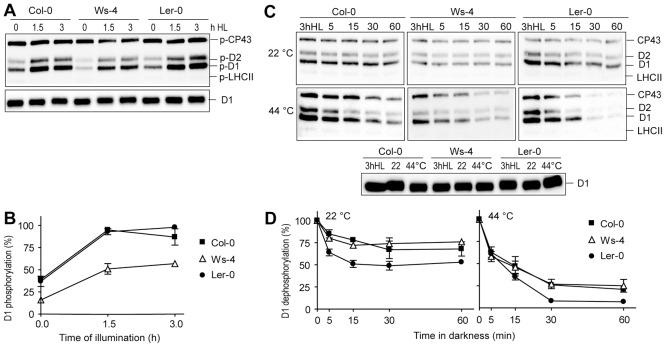
Figure 7. Time course of PSII protein phosphorylation and dephosphorylation in Col-0, Ws-4 and Ler-0 accessions.
(A) In vivo steady-state PSII protein phosphorylation. Intact plants grown hydroponically were illuminated for 0, 1.5 and 3 h with high light (HL = 950 µmol photons m−2 s−1), followed by isolation of thylakoids in the presence of NaF, and western blot analysis with Zymed antibody. A western blot of the same samples was performed with anti-D1 antibody, and used as a loading control. (B) Plot of data shown in panel A, where quantification levels are expressed relative to phosphorylation in Col-0. (C) In vitro PSII protein dephosphorylation. Thylakoid membranes were isolated from 3 h HL treated plants in the presence of NaF, and incubated in darkness at 22° or 44°C for the indicated periods of time. Samples were blotted using a Zymed antibody. The western blot with anti-D1 antibody of samples from 3 h HL plants and incubated in darkness at 22° or 44°C for 60 min indicates equal loading of the gels. (D) Plot of C, representing % remaining D1 phosphorylation, 100% = initial phosphorylation level in each accession. The plotted data in (B) and (D) are means ±SD (n = 3). SD bars are shown when larger than the symbols.

