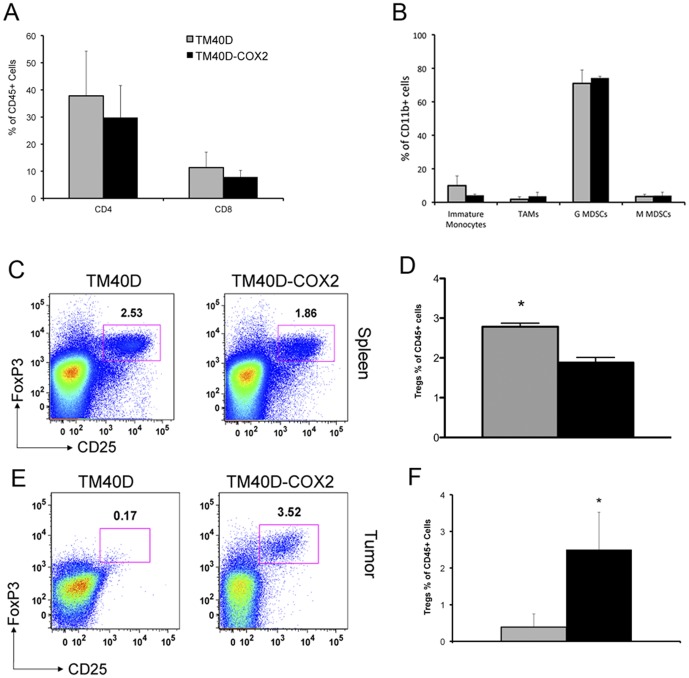
Figure 2. Tumor immune profile reveals elevated Tregs levels.
TM40D (grey bar) or COX2 over-expressing TM40D-COX2 (black bar) cells were implanted in the fourth mammary pad of Balb/c mice. At maximum tumor volume tumors were assessed for (A) CD4+ and CD8+ T-cells, (B) immature monocytes (CD11b+ F4/80+ Ly6g+), tumor associate macrophages (CD11b+ F4/80+ Ly6g−), G MDSCs (CD11b+ Ly6clow Ly6g+) and M MDSCs (CD11b+ Ly6Chi Ly6g−). Tregs (FoxP3+CD4+ CD25+) were assessed via flow cytometry of spleens from TM40D and TM40D-COX2 challenged mice (C). Quantitative analysis of Tregs observed in the tumor of tumor challenged mice (D). Representative Treg levels in the primary tumor of mice challenged with TM40D or TM40D-COX2 mammary tumor cells (E). Quantitative analysis of Tregs observed in the spleen of TM40D versus TM40D-COX2 challenged mice (F). p<0.05 compared to TM40D group, n = 4–5 animals per group. *p<0.05 compared to TM40D.

