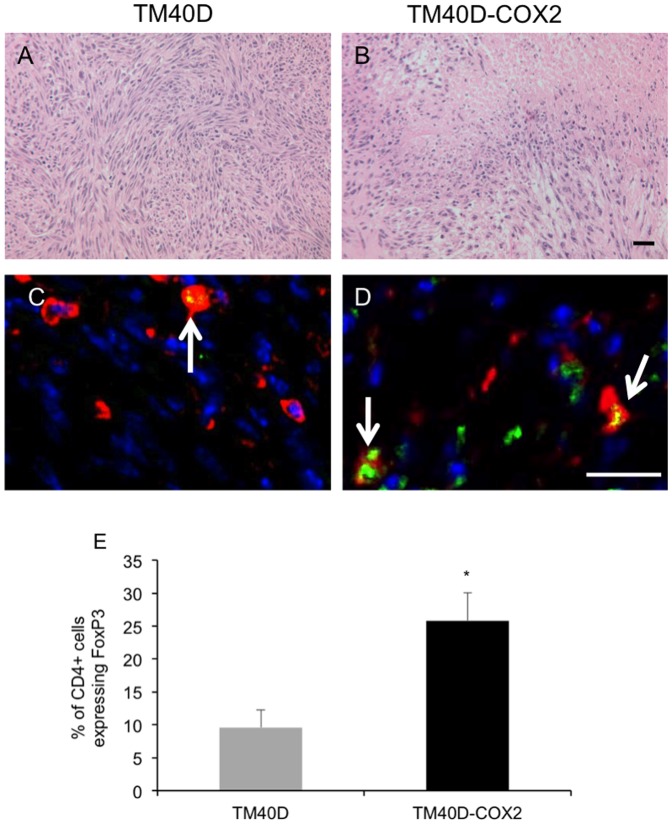
Figure 3. TM40D-COX2 tumors preferentially recruit Tregs to the tumor.
Histological sections of TM40D and TM40D-COX2 tumors were stained with (A and B) H&E or (C and D) AlexaFluor 594 for CD4 (RED) AlexaFluor 488 for FoxP3 (GREEN), or Dapi for nucleus (BLUE). Arrows in panels C and D represent Tregs. E. Quantitative analysis of panels C and D measuring the percent of CD4+ cells that have FoxP3 co-localized to the cell. N = 3 samples per group, 8–10 sections per sample. *p<0.01 compared to TM40D. Bar = 20 µm.

