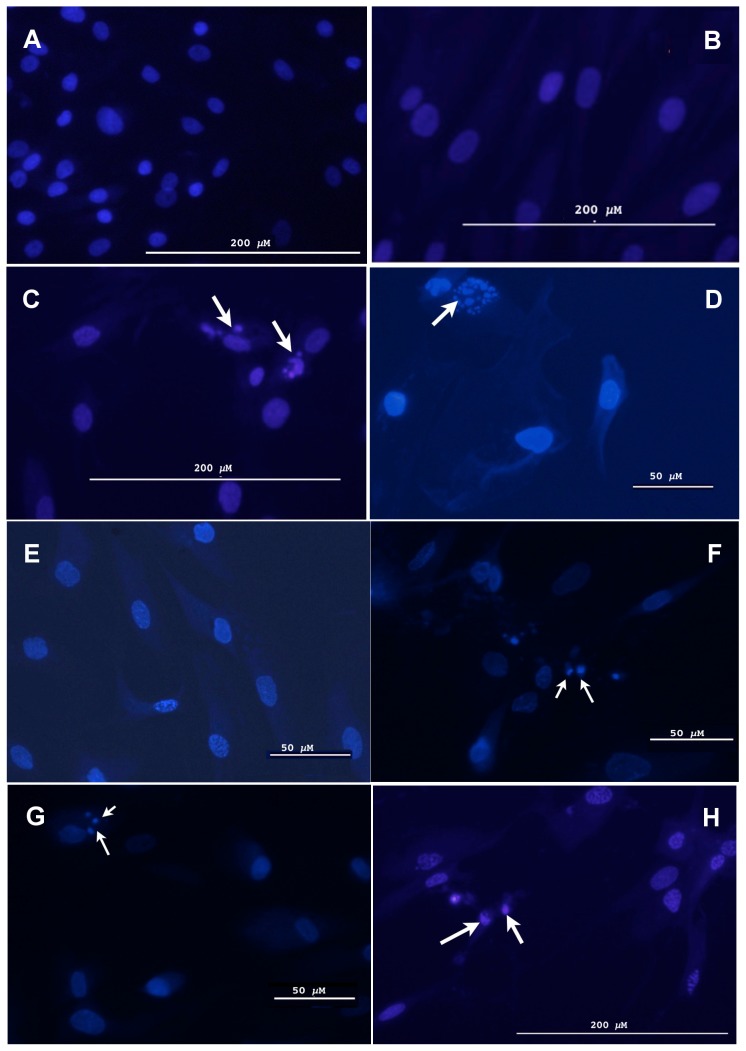
Figure 3. Human cells display morphological features characteristic of reduced apoptotic function relative to chimpanzee and macaque cells after treatment with MMC.
Cells treated with MMC for 72 hrs were stained with 10 µg/ml of Hoechst 33342 and visualized under a fluorescence microscope. More than 100 cells were examined in 4 separate views (>25 cells per view). The pictures displayed are representative of the overall results. (A) Chimpanzee cells (S006007) untreated (note: untreated human cells display the same phenotype as untreated chimpanzee cells); B) Human cells (AG13153) treated with 10 µM of MMC; C) Chimpanzee cells (S006007) treated with 10 µM of MMC; D) Macaque cells (AG07915) treated with 10 µM of MMC; E) Human cells (AG07307) treated with 15 µM of MMC; F) Chimpanzee cells (S005795) treated with 15 µM of MMC; G) Macaque cells (AG07128) treated with 15 µM of MMC; and H) Human cells (AG13153) treated with 100 µM of MMC. Arrows indicate nuclei displaying an apoptotic phenotype (i.e., chromatin fragmentation/condensation, C, D, F, G and H). Control cells (A) display a normal cellular phenotype.

