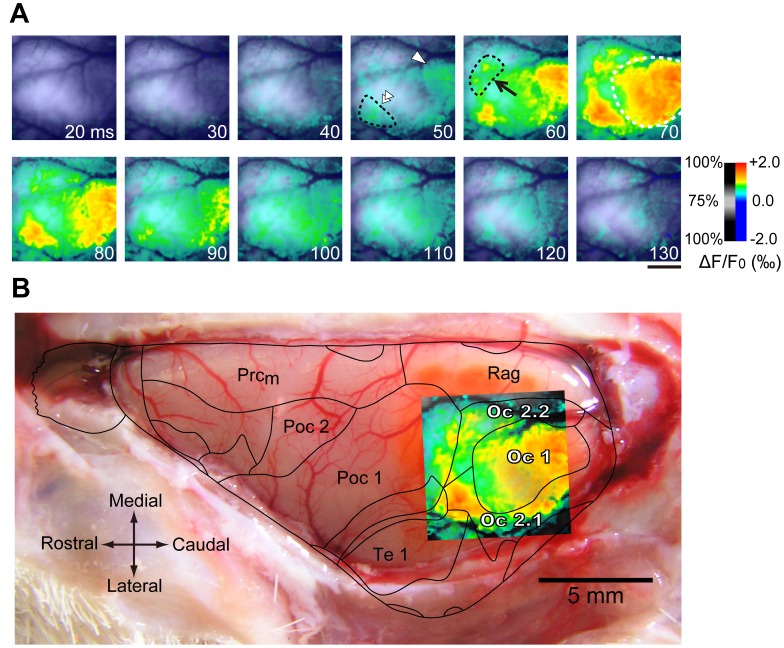
Figure 1. Identification of visual areas in the guinea pig occipital cortex.
(A) A time-series of frames showing color-encoded cortical activity responding to a flash light stimulus in the left occipital cortex. Color-encoding used the color bar shown to the right, and the encoded color image was superimposed on the cortical surface with transparency defined by the transparency bar shown next to the color bar. The white number in each figure represents time after stimulus onset in ms. At 50 ms after stimulation, responses were observed in a caudal area (white arrowhead in the fourth graph of the upper row) and in a rostrolateral area (double white arrowhead). At 60 ms after stimulation, responses became evident in a rostromedial area (arrow in the fifth graph of the upper panel). The response peaked around 70 ms and declined thereafter. Scale bar is 2 mm. (B) Superimposition of cortical activity on the surface of the left hemisphere, which was exposed after recording. To identify visual areas, borders between cortical areas reported in guinea pigs by Wree et al. [29] were also superimposed. It is clear from the figure that the majority of the caudal responding area corresponds to occipital area 1 (Oc1), the rostrolateral responding area largely corresponds to a rostral portion of Oc2.1, and the rostromedial responding area largely corresponds to a rostromedial portion of Oc2.2. In the subsequent figures, we refer to the caudal area as V1, the rostrolateral area as LV, and the rostromedial area as RV. Other abbreviations follow Wree et al. [29]. Scale bar is 5 mm.

