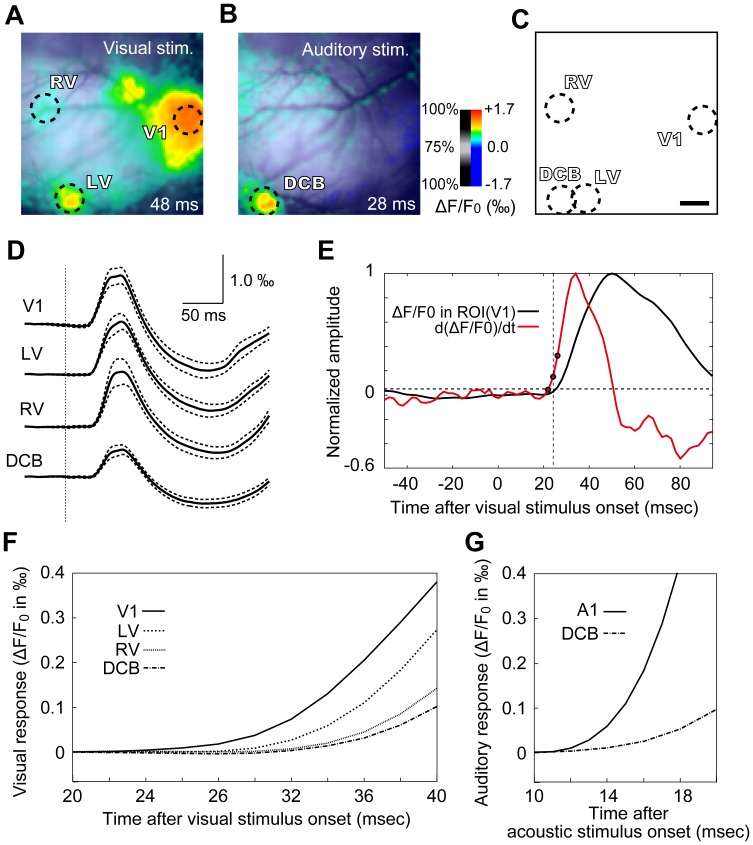
Figure 2. Visual responses and onset latencies in cortical fields.
(A) Cortical response to visual stimulation at 48 ms after stimulus onset. Responses in the V1, LV, and RV areas were readily recognizable, and the three areas were well separated from each other. A circular ROI with a diameter of 1 mm was set in each of the subfields to include the response epicenter and to cover as many responsive pixels as possible. (B) Response to auditory stimulation at 28 ms after stimulus onset; recorded in the same cortical field as in (A). Response in the dorsocaudal belt portion of the auditory cortex (DCB) is readily recognizable. An ROI was set on the DCB similar to the visual fields. (C) Summary illustration of ROIs in the recording field. Note the partial overlap between DCB and LV. (D) Responses to visual stimulation in all pixels within an ROI were averaged for each animal, and data from 10 animals were then pooled together. The black trace is the population mean and the dotted lines represent SEM. The vertical dotted line marks the onset time of visual stimulus. (E) The averaged visual response in the ROI of V1 in one animal (the black trace) is shown together with its differentiated trace (the red trace). The dotted line marks the sample point (the middle circle) at which the differentiated signal first exceeded baseline level. (F) The mean traces in (D) are shown at a higher magnification, illustrating that visual responses occurred in the order of V1, LV, RV, and DCB. (G) For comparison, the population average of auditory responses in A1 (n = 6) and in DCB (n = 10) are shown. Scale bar in (C) is 1 mm and also applies to (A) and (B). Other conventions follow Fig. 1.

