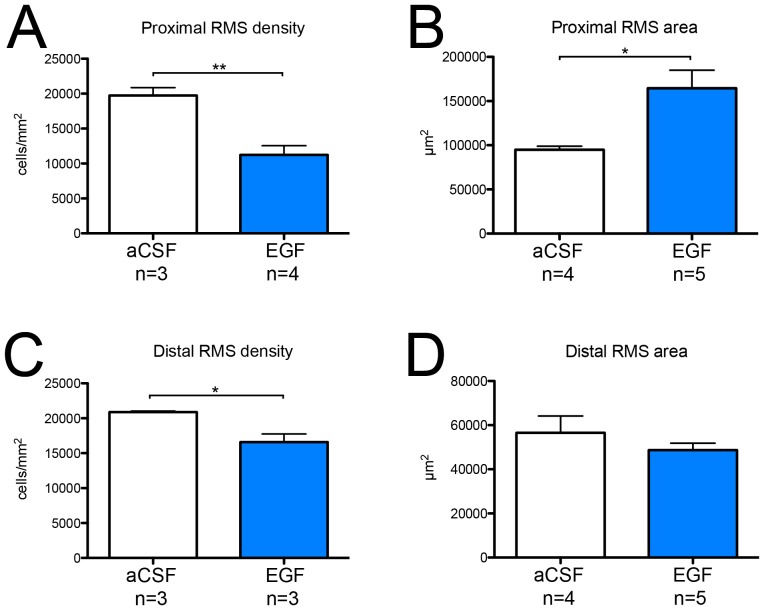
Figure 1. Cell density and size of the rostral migratory stream after EGF infusion.
To assess EGF-induced structural changes in the rostral migratory stream (RMS) cell density and cross-sectional area were quantified at a proximal and a distal position relative to the SVZ. (A, C) Cell density was determined by counting cell nuclei and expressed as the number of cells per mm2 ± SEM. (B, D) The size of the RMS was determined by tracing the border of the RMS on coronal sections. Data are presented as average cross-sectional area per section expressed in mm2 ±SEM. For both analyses 1–4 coronal sections per animal were used. Statistical significance was assumed at * p<0.05 and ** p<0.01 using Student's t-test.

