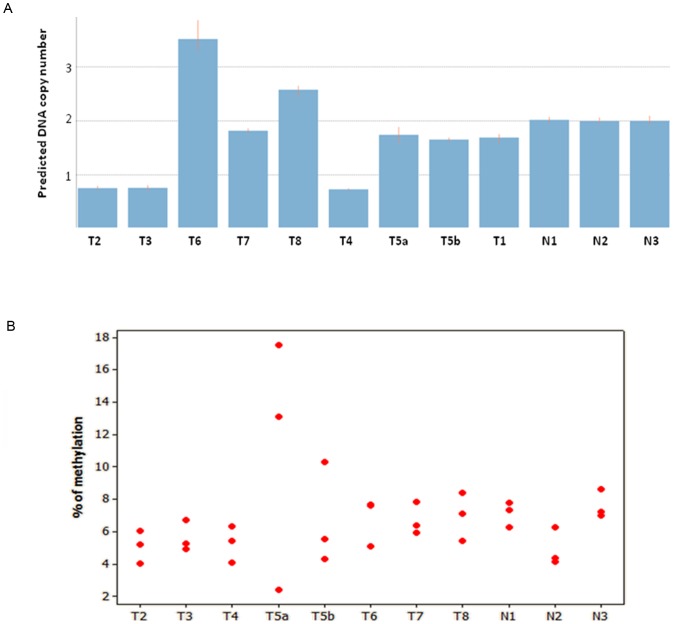
Figure 2.
(A) Bar graph showing predicted DNA copy number of the CDC73 gene using TaqMan DNA copy number analysis. Each bar represents one parathyroid sample and the height of the bar represents the predicted CDC73 gene DNA copy number. T2, T3 and T4 had 1 copy of CDC73 gene, while T6 and T8 had more than 2 copies. N1, N2 and N3 refer to the normal parathyroid samples used as calibrators. (B) Individual value plot illustrating the methylation density at the three analyzed CpG dinucleotides of the HPRT2 promoter. Each red dot represents one CpG site in one parathyroid tumor numbered from T2–T8 along with the three normal references denoted as N1, N2 and N3.

