
Figure 2. The in vitro angiogenic properties of MSCNull and MSCCXCR4.
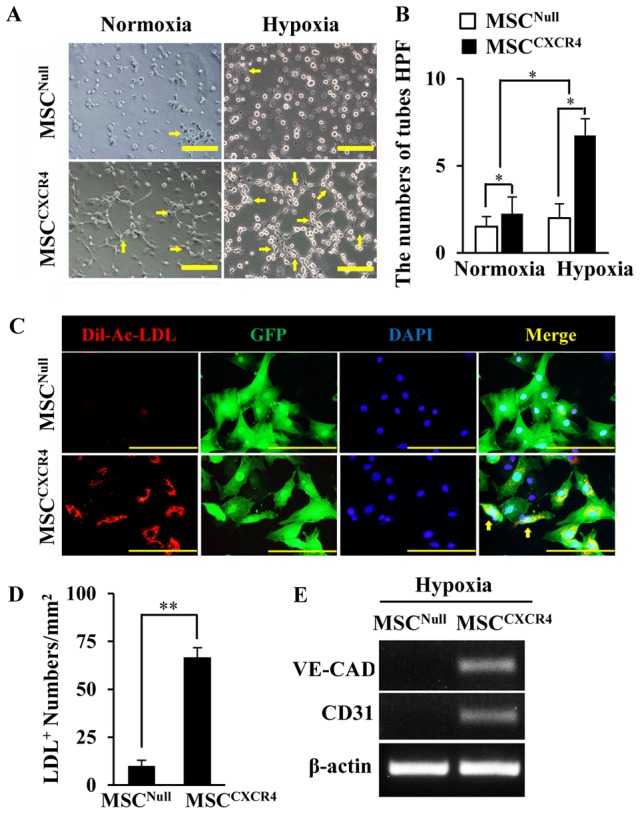
(A): The new tube formation of MSCs under normoxia or hypoxia is showed (yellow arrows). Scale bars = 200 µm. (B): Quantification of total tube numbers in high power fields (HPF) was calculated. (C): The EC differentiation under hypoxia is identified by the uptake of Dil-ac-LDL (red); Viral manipulated MSCs are showed by GFP (green); All nuclei are stained with DAPI (blue). Scale bars = 100 µm. (D): Quantification of positive Dil-ac-LDL cell numbers per mm2 was calculated. (E): The expression of endothelial specific markers (VE-cadherin and CD31) was analyzed by RT-PCR in MSCCXCR4 under hypoxia for 72 hours. CAD, cadherin. * p<0.05; ** p<0.01. Data are the mean ± SD (n = 4).