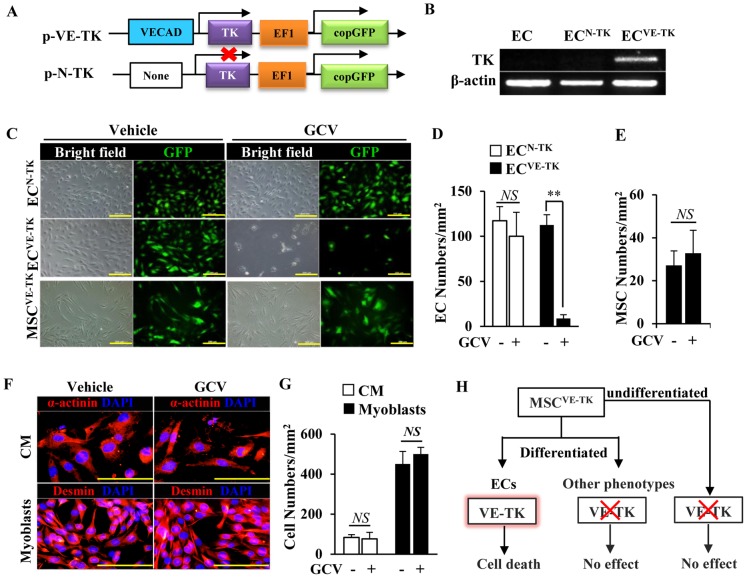
Figure 4. Transduction of TK for suicide gene delivery and the effect of GCV on cell growth.
(A): Schematic diagram of suicide gene vector p-VE-TK and its promoterless control vector p-N-TK; VECAD, VE-cadherin promoter; TK, HSV1-thymidine kinase; EF1, constitutive elongation factor 1 α promoter; copGFP, copepod green fluorescent protein. (B): The TK gene was expressed in ECVE-TK, but not in ordinary ECs or ECN-TK, as analyzed by RT-PCR. (C): Viral manipulated ECs are showed by GFP (green) and contrast ECs in the bright field of light microscopy. Scale bars = 200 µm. (D): Quantification of viable EC numbers. (E): Quantification of viable MSC numbers. (F): Effect of GCV on cardiomyocytes identified by α-actinin (red) and myoblasts identified by desmin (red). All nuclei are stained with DAPI (blue). Scale bars = 100 µm. (G): Quantification of viable cardiomyocyte and myoblast numbers. (H): Schematic diagram for showing that GCV can induce the cell death of ECs derived from MSCs with TK expression which is inactivated in other phenotype or undifferentiated cells. CM, cardiomyocytes; GCV (−), vehicle; GCV (+), ganciclovir 100 µM. ** p<0.01. All values are expressed as mean ± SD (n = 4).

