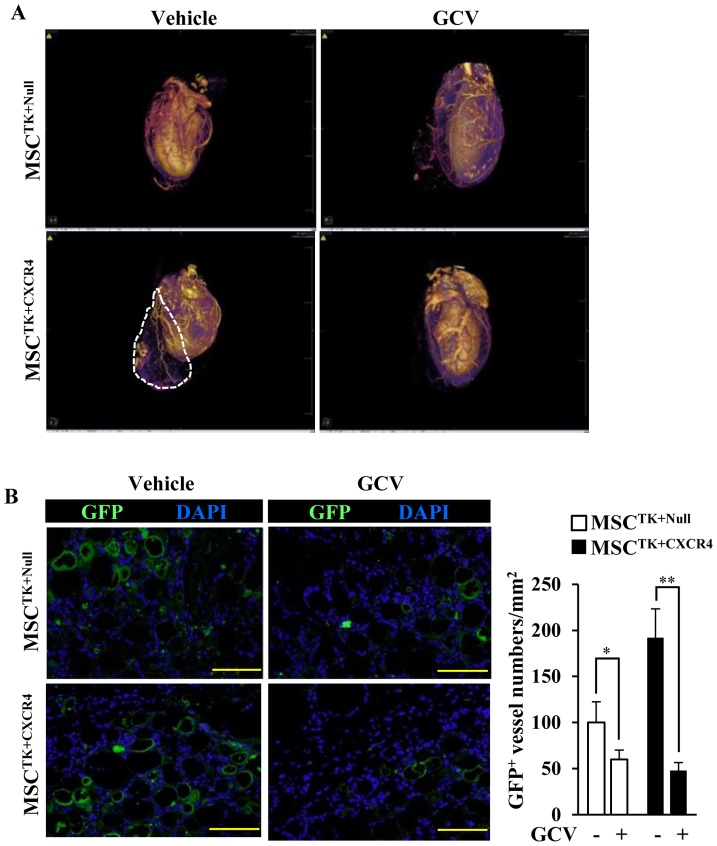
Figure 6. Micro-CT scan shows the vessel distribution in the whole heart.
(A): The perfusion of contrast agents indicates the cardiac vessel networks of various groups. The dotted line shows the location of cell patch. (B): In cell patch, the new formed vessels are identified by GFP (green) and quantitative data. All nuclei are stained with DAPI (blue). Scale bars = 100 µm. * p<0.05; ** p<0.01. All values are expressed as mean ± SD (n = 4).

