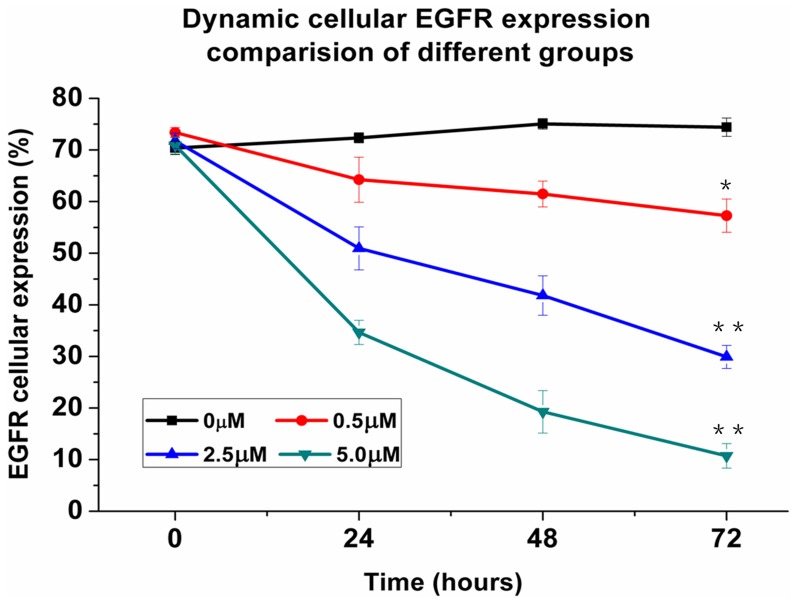
Figure 2. The cellular EGFR expression percentage of different treatment groups in vitro assessed by flow cytometry.
The dynamic EGFR cellular expression percentage after treatment of different concentrations of As2O3 (0 µM, 0.5 µM, 2.5 µM, 5.0 µM) varied with time (*p<0.05, **p<0.01). All experiments were carried out in triplicate; each point represents the mean ± standard error values.

