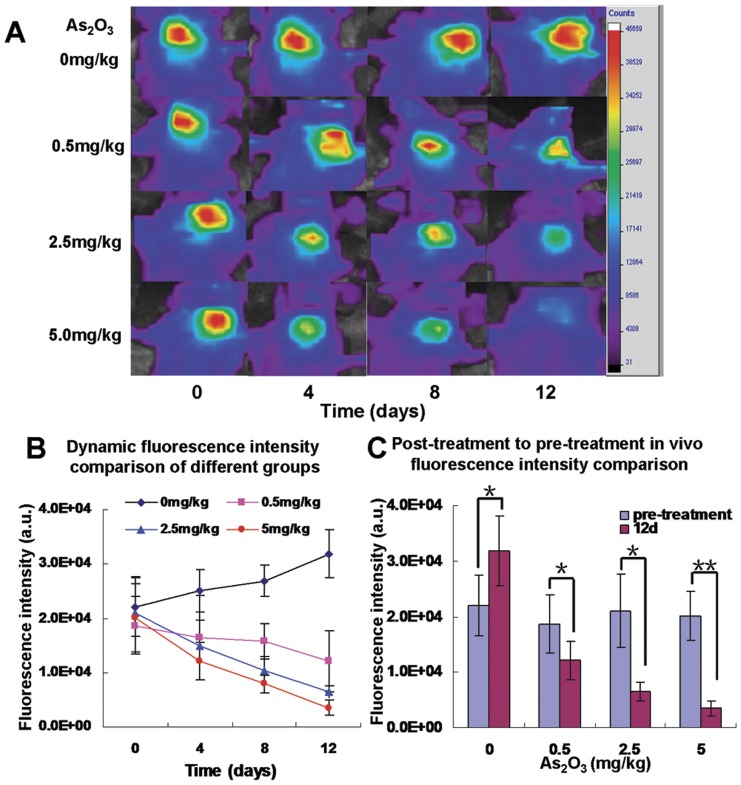
Figure 3. In vivo dynamic near-infrared fluorescent imaging of A-431 tumor models.
A: The representative fluorescence images of the tumor regions in mice were acquired at 4 h post injection of EGF-Cy5.5. Fluorescence signal from Cy5.5 was pseudo-colored red. B: The dynamic measurement comparison of fluorescence intensity of tumor in different groups. It was demonstrated that the fluorescence intensity in the tumor regions were changed with time (p<0.05). On day 0 (before As2O3 treatment), there was no significant difference of signal intensity of tumors between treatment and control groups (p>0.05). On day 4, 8, 12 (after As2O3 treatment), the signal intensity of EGF-Cy5.5 uptake by control group (0 mg/kg/day As2O3) gradually increased, while the intensities in other three groups with different concentrations (0.5 mg/kg/day, 2.5 mg/kg/day, 5.0 mg/kg/day) of As2O3 treatment gradually decreased (p<0.05). C: The in vivo fluorescence intensity was compared between post-treatment (on day 12) in four different groups compared with respective pre-treatment (on day 0). All plots are representative of results from groups of mice treated under the same experimental conditions. Each point represents the mean values (n = 6/group, *p<0.05, **p<0.01).

