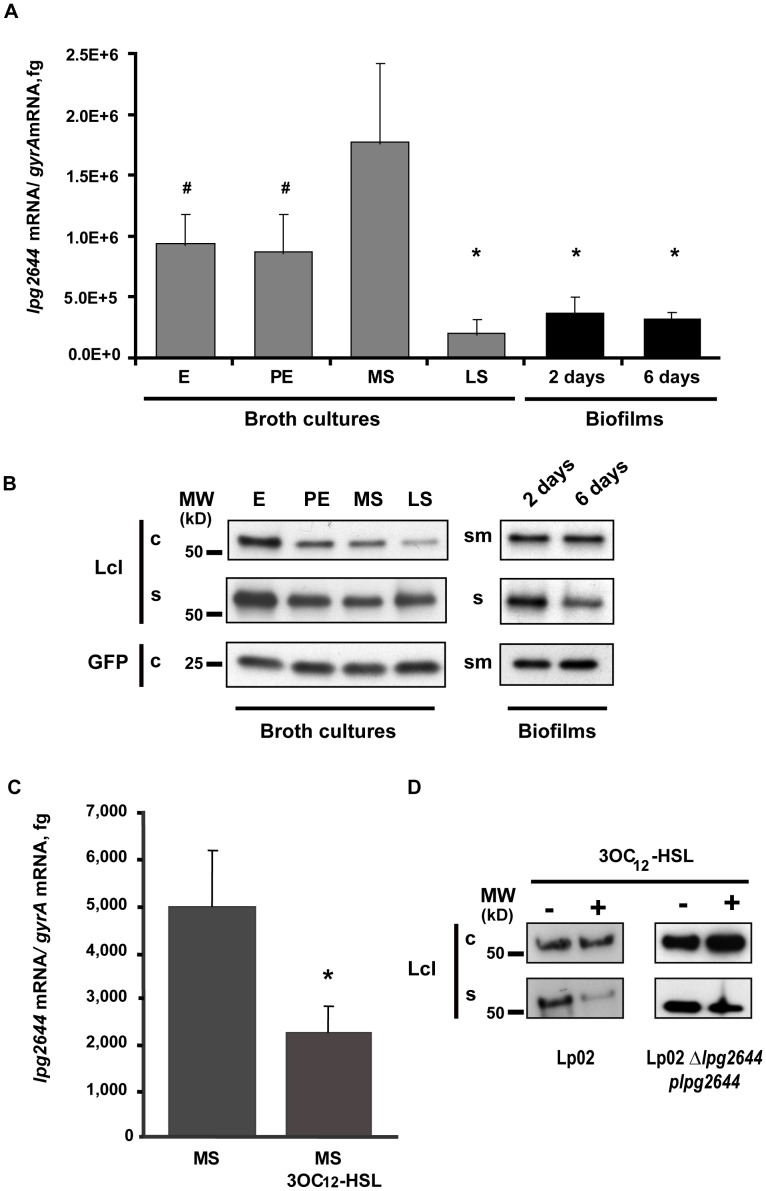
Figure 6. Transcriptional regulation of lpg2644 and synthesis of Lcl in broth cultures, biofilm and in presence of 3OC12-HSL homoserine lactone.
Amounts of lpg2644 transcripts and synthesis of Lcl were respectively measured by (A) qRT-PCR and (B) anti-Lcl immunoblot analysis of cell pellet (c) supernatant (s) and sessile cells/matrix (sm) fractions in Lp02 harvested from exponential (E), post-exponential (PE), mid-stationary (MS), late stationary (LS) broth cultures and biofilms (2 and 6 days old). Quantitative RT-PCR values are means+/−s.d. from three individual experiments. # two-tailed Student’s t-test P-value ≤0.01 versus MS phase, * two-tailed Student’s t-test P-value ≤0.001 versus MS phase. (C) Effect of 3OC12-HSL homoserine lactone on lpg2644 transcription and (D) Lcl synthesis. Lp02 was grown in absence or in presence of 3OC12-HSL (10 µM) for 24 h. Transcriptional level of lpg2644 was determined by qRT-PCR analysis. Data are representative of 3 independent experiments.* Student’s t-test P-value ≤0,001 versus untreated Lp02. (D) Synthesis of Lcl was estimated by anti-Lcl immunoblot of cell pellets (c) and supernatant fractions (s) of Lp02 and Lp02 Δlpg2644 plpg2644. The positions of the molecular size markers are indicated on the left of the blot in kDa.

