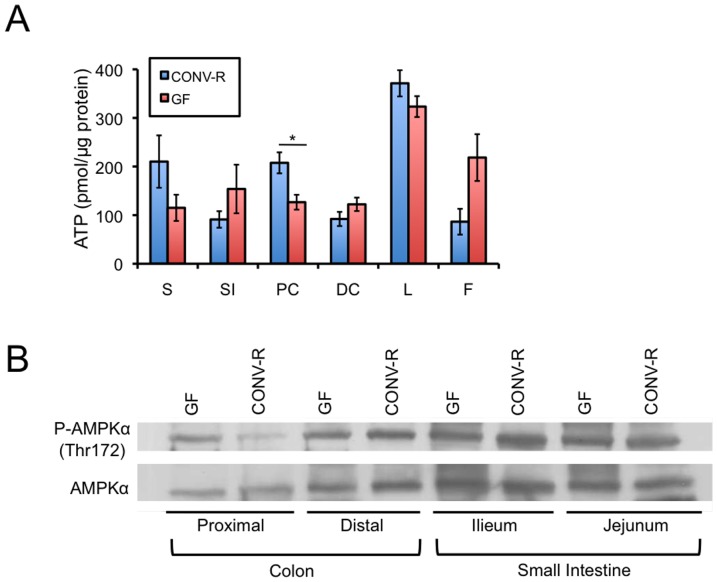
Figure 1. Effects of microbiota on energy metabolism biomarkers in the GI tract and digestive tissues.
A, ATP levels in the stomach (S), small intestine (SI), proximal colon (PC), distal colon (DC), liver (L), and fat (F) (white adipose tissue) of CONV-R and GF mice. Five CONV-R and five GF mice were analyzed, and the results are mean ± standard error. Significant differences are indicated (*p<0.05). B, Western blot analysis of AMPKα phosphorylated at Thr172 (top panel) and total AMPKα (bottom panel) in different segments of the colon and small intestine from GF and CONV-R mice. Results are representative of 3 independent experiments.

