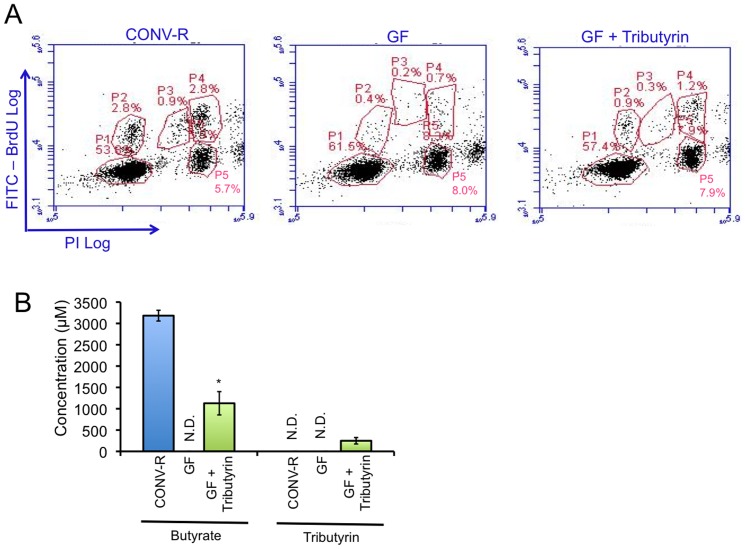
Figure 5. Microbes and butyrate promote cell-cycle progression at the G1-to-S phase transition.
A, Flow cytometry profiles of colonocytes from CONV-R mice (left), GF mice (center), and GF mice provided a tributyrin-fortified diet (right). PI levels are shown on the x-axis, and BrdU incorporation is shown on the y-axis. The percentage of cells in various stages of the cell cycle are indicated: P1, G1; P2, early S; P3, middle S; P4, late S; P5, G2. Results are representative of 3 independent experiments. B, Measurements of luminal butyrate (left) and tributyrin (right) levels from the colon of CONV-R mice and GF mice provided either a provided a control diet (GF) or a tributyrin-fortified diet (GF + Tributyrin). Results are mean ± standard error from 3 independent experiments with significant differences indicated (*p<0.01). N.D., not detectable.

