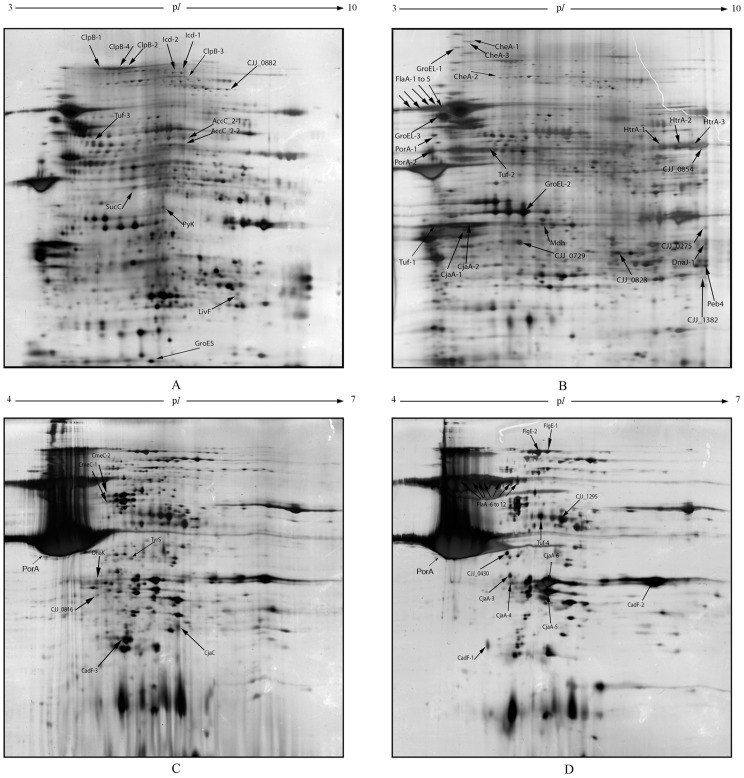
Figure 2. Two-dimensional electrophoresis (2-DE) profiles of the inner (A, B) and outer membrane proteins (C, D) of oxygen-acclimated cells (B, D) compared to non-acclimated cells (A, C) of C. jejuni 81–176.
On profiles A and C, arrows indicate the significant lower-abundance proteins (or protein forms) in oxygen-acclimated cells while on profiles B and D, arrows indicate the significant higher-abundance proteins (or protein forms) in oxygen-acclimated cells. PorA was identified as the major protein on OMP profiles.

