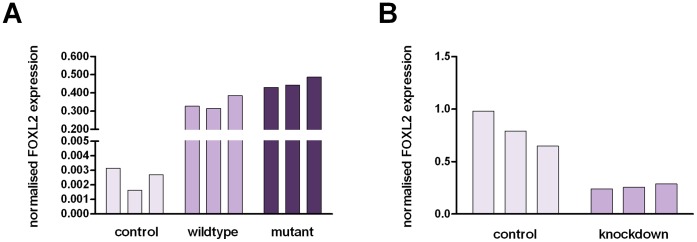
Figure 1. Confirmation of FOXL2 overexpression (A) and knockdown (B) assessed with RT-qPCR.
Expression values are plotted as normalised values for each control and treated sample. Errors represent technical error associated with RT-qPCR for each sample. The overexpression of wildtype and mutant FOXL2 resulted in greater than a 120 fold increase in FOXL2 expression in COV434, when compared to control cells. siRNA-targetted cells showed 0.3 times the level of FOXL2 expression observed in control cells following mutant FOXL2 knockdown in KGN.

