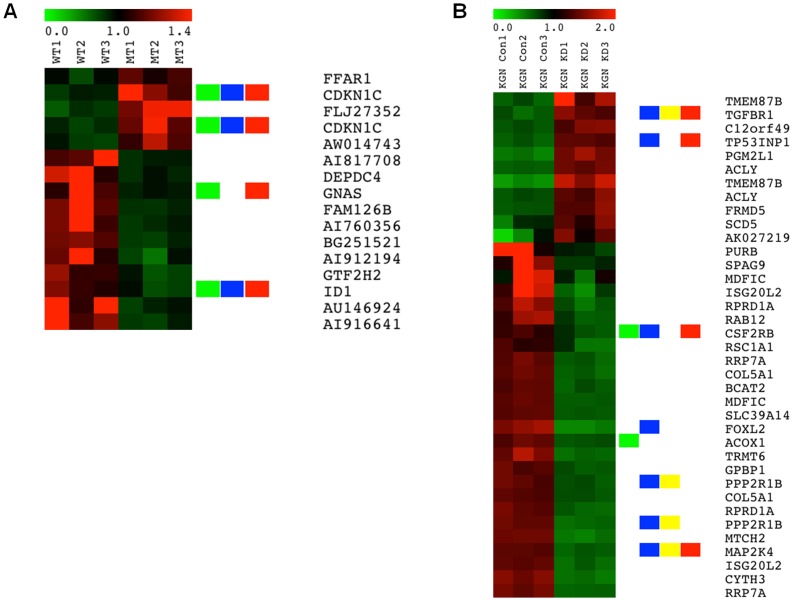
Figure 3. Gene expression profiles associated with mutant FOXL2 overexpression in COV434 cells (A) and mutant FOXL2 knockdown in KGN cells (B).
Each heatmap shows signature genes of KGN with LIMMA p<0.01 and absolute fold change >2 and COV434 with LIMMA p<0.01 and absolute fold change <1.4. In the image red refers to upregulation and green is downregulation. The green, blue, yellow and red bars highlight genes annotated by tumourigenesis, cell death, TGF-β signalling and proliferation, respectively.

