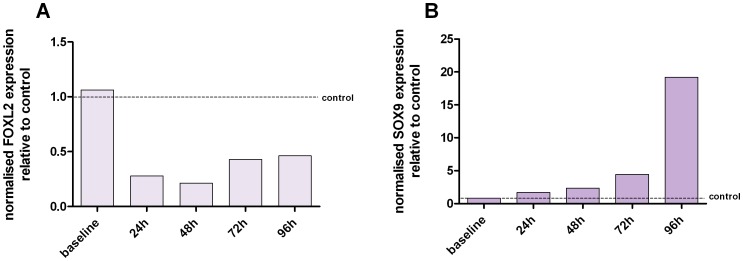
Figure 5. The expression of SOX9 post FOXL2 knockdown in KGN cells.
Figure 5A confirms the knockdown of FOXL2 expression and Figure 5B depicts SOX9 expression at each corresponding time point. Each expression value has been normalised to the expression values of three reference genes and have been plotted relative to the control cells (data not shown). Over a 96 h time period, the knockdown in FOXL2 expression resulted in a steady increase in SOX9 expression. Baseline refers to expression levels ascertained before knockdown.

