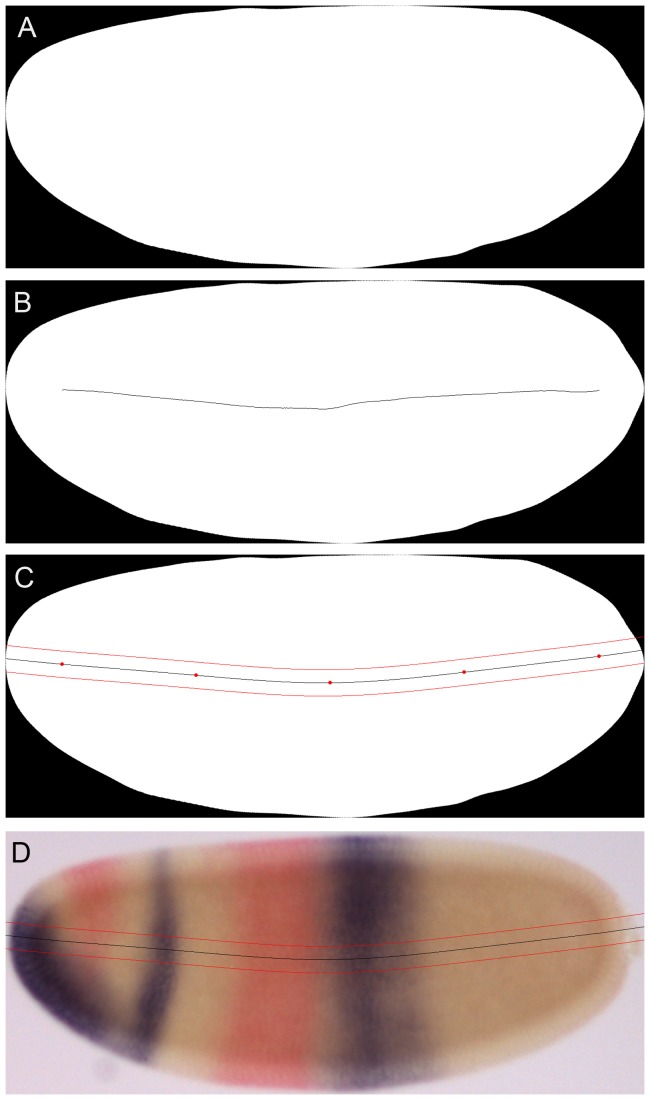
Figure 3. Determination of the 10% strip for profile extraction along the A–P axis.
The embryo mask (A) is used to calculate the morphological skeleton shown in (B). Along this skeleton we position 5 equidistant points (red dots in C), though which we draw a cubic spline (solid black line in C). This spline is extended to the embryo borders using Lagrange extrapolation. It is then used to determine a band (or strip) that extends 10% along the minor (or dorso-ventral, D–V) axis of the embryo (5% above and below the spline; red lines in C). Expression profiles are extracted from the bright-field image by measuring the average staining intensity of vertical pixel columns that fall within the strip (D).

