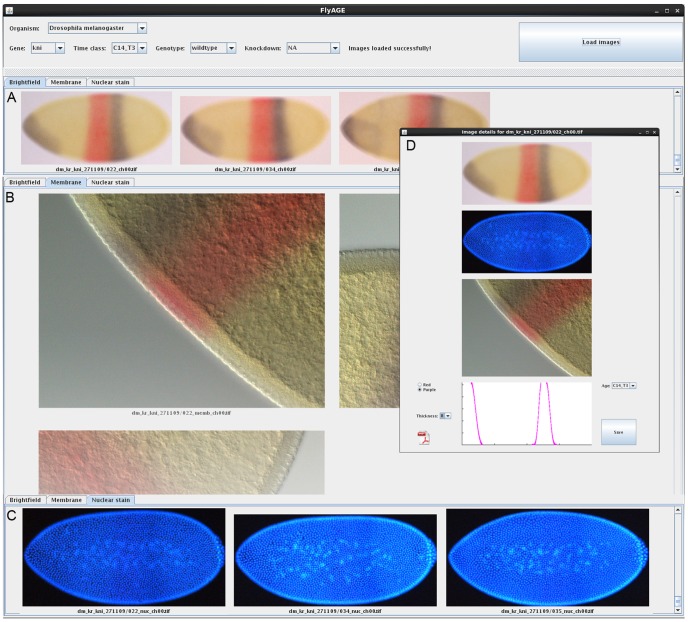
Figure 4. Time classification using FlyAGE.
Screenshot displaying the FlyAge programme, which enables the visualisation of all embryos stained for a particular gene at a particular time class. (A) Drop-down menus at the top of the screen allow the user to select ‘Organism’, ‘Gene’, ‘Time class’, ‘Genotype’ and ‘Knock-down’. Pressing the ‘Load Images’ button displays montages of bright-field images (A), membrane details (B), and nuclear counterstains (C) in separate tabs. (D) Bright-field images, nuclear counterstain, membrane details, and expression slopes (boundaries) can be viewed together in a pop-out window for each individual embryo by clicking on the bright field image. Identified outliers, or misclassified embryos can be reclassified in this window by selecting the correct age from the ‘Time class’ drop-down menu.

