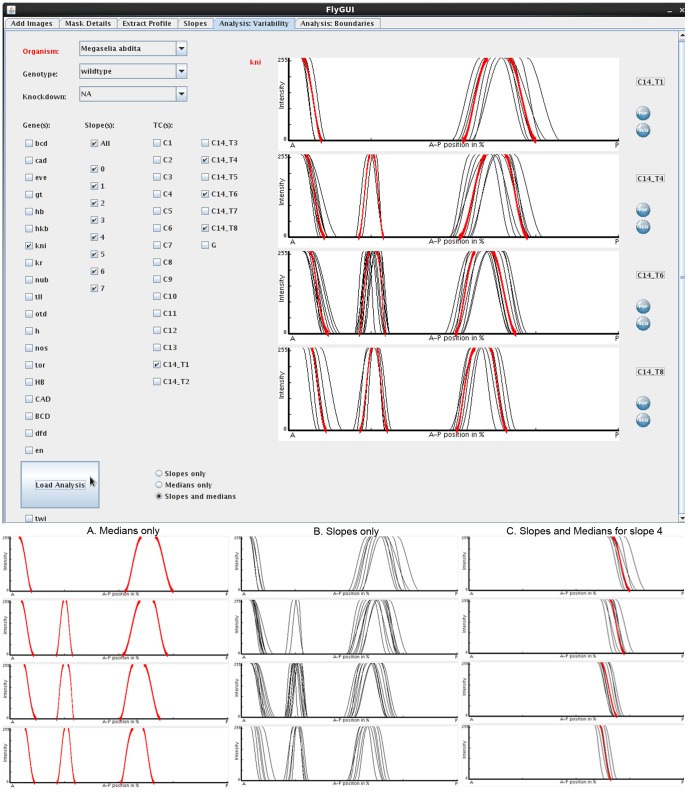
Figure 9. FlyGUI: analysing positional variability.
Screenshot displaying the ‘Analysis: Variability’ tab of our FlyGUI. This tab allows us to plot sets of expression boundaries for specific genes and time classes. Individual slopes and medians can be displayed together (main panel), or separately as median-only (A), or as slopes-only (B) graphs. Either entire gene expression patterns (main panel), or individual slopes (C) can be plotted. Median slopes for multiple genes can be combined (not shown). See text for details.

