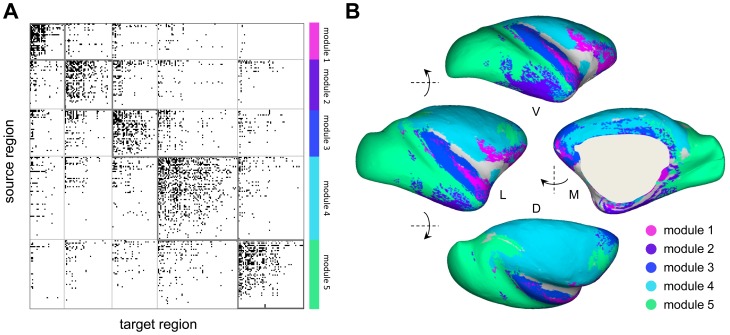
Figure 2. Connection matrix and network communities (modules).
(A) Binary connection matrix comprising 242 regions and 4090 directed projections. Regions are arranged by module assignment, and within each module they are ranked by their degree (sum of in-degree and out-degree). The node ordering and module assignments are reported in the Supplementary Information. (B) Surface rendering of the inflated right hemisphere of macaque cortex, with surface regions color-coded by to their module assignments. Some points on the surface corresponded to multiple cortical regions since multiple schemes for regional parcellations were used for surface mapping. This could lead to multiple module assignment for a given surface point. In case of multiple assignments, regions were colored according to a majority rule, choosing the mode of the distribution of module assignments. In the case of a tie, a module was chosen at random from the tied set, resulting in a mottled appearance. Surface plots at left and right show lateral (L) and medial (M) views; plots at top and bottom show ventral (V) and dorsal (D) views.

