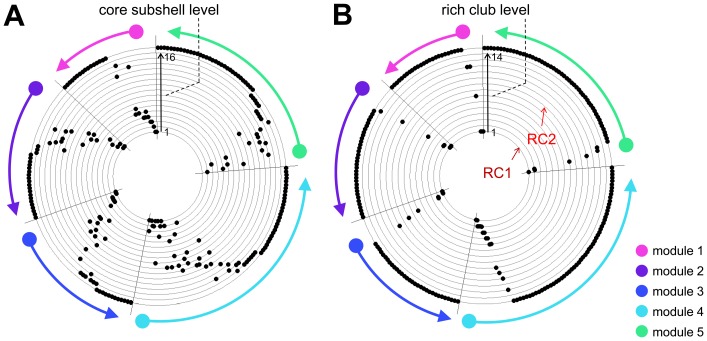
Figure 5. Comparison of core subshells and rich club members.
In both plots, the nodes are arranged along a circle, in the same order (by module and degree) used for displaying the connection matrix in Figure 2A, starting counterclockwise at the top. (A) Core subshell levels are displayed as concentric rings, with the innermost subshell nearest to the center of the circle. Regions are marked as black dots according to their subshell level. (B) Rich club levels are displayed as concentric rings, with the tightest rich club (RC1) corresponding to rich club level 1. Regions are marked as black dots according to their rich club level.

