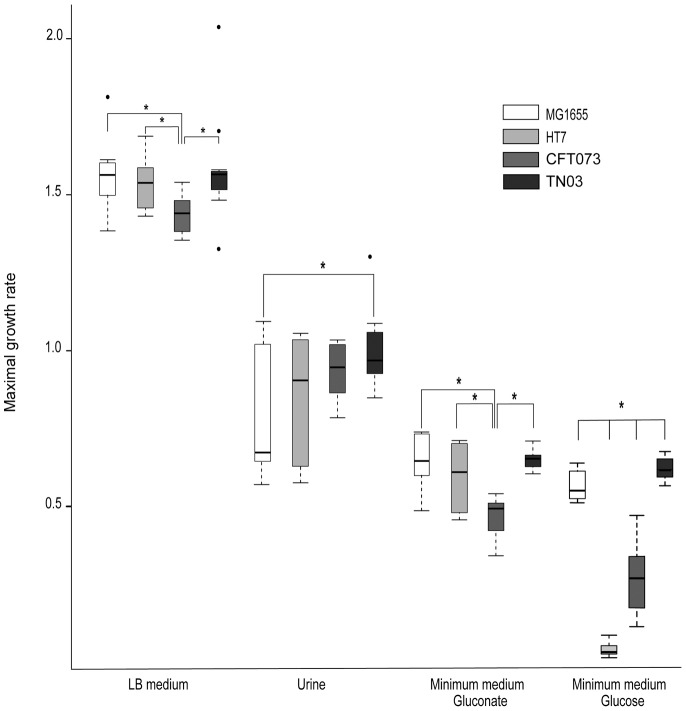
Figure 2. Maximum growth rate in four media.
Four E. coli strains: K-12 MG1655 (white), HT7 (light grey), CFT073 (grey) and TN03 (dark grey) were grown in four different media: Luria Bertani (LB), urine, minimum medium with gluconate and minimum medium with glucose. Boxplots represent distribution of maximal growth rates (MGRs) calculated during the three repetitions of culture assays with the smooth spline function from R network. Black bars inside each boxplot represent medians. Dots located far from the box represent outliers. Links between boxplots with asterisks represent significant differences between two strains tested by Welch test for observed mean comparison. * p<0.05.

