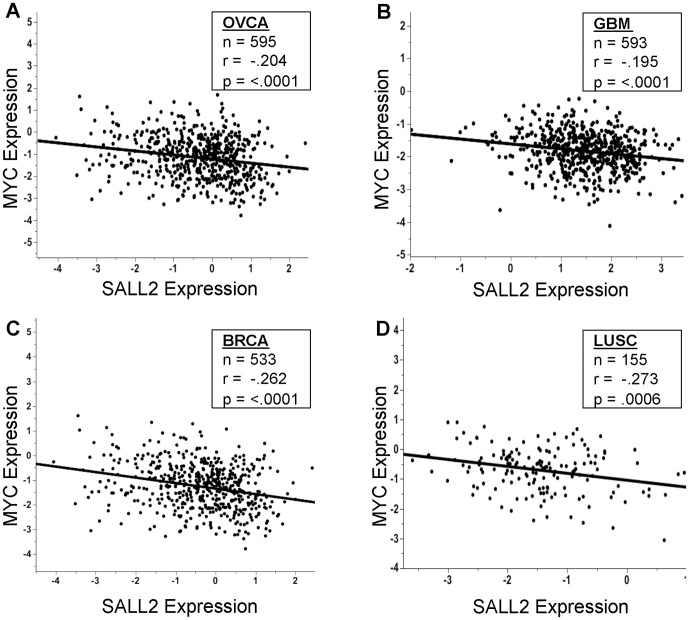
Figure 4. SALL2 by c-MYC expression scatterplots for cancer types in The Cancer Genome Atlas.
(A) OVCA - ovarian serous cystadenocarcinoma. (B) GBM – glioblastoma multiforme. (C ) BRCA – breast invasive carcinoma. (D) LUSC – lung squamous cell carcinoma. n = number of samples; r = Pearson correlation coefficient; p = p-value of the correlation. The lines shown are those of best fit.

