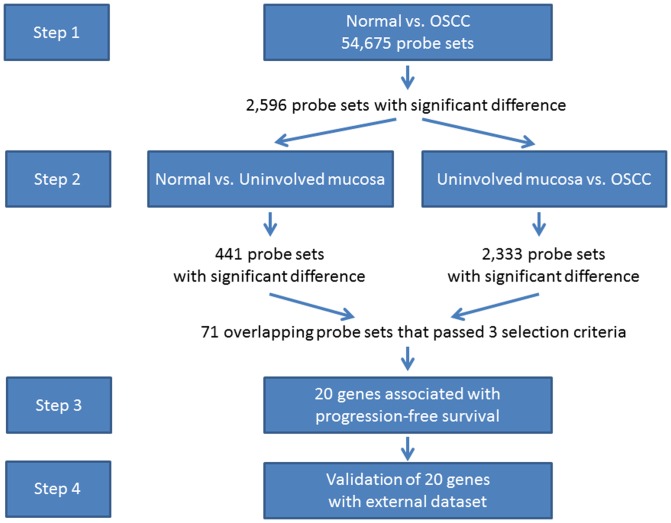
Figure 1. Steps for statistical analyses.
Step 1, compared normal mucosae from non-cancerous patients to cancer tissues from OSCC patients to identify genes associated with OSCC and to reduce the number of genes for further comparison. Step 2 had two comparisons: 1) compared normal mucosae from non-cancerous patients to uninvolved mucosae from OSCC patients, 2) compared uninvolved mucosae from OSCC patients to cancer tissues. We then selected the genes that overlapped between the two comparisons and passed three selection criteria (i. the Bonferroni adjusted p-value must be less than 0.05 in both comparisons; ii. the magnitude of the difference in expression level must be greater than one standard deviation of the expression in the uninvolved oral samples; iii. the direction of the coefficients of each gene must be the same in both comparisons, i.e. the coefficients must be positive in both comparisons for up-regulated genes, and must be negative for both comparisons for down-regulated genes. Step 3 among the genes selected from step 2, we identified those that were associated with progression-free survival. In Step 4, we validated the genes identified in Step 3 using an independent external dataset.

