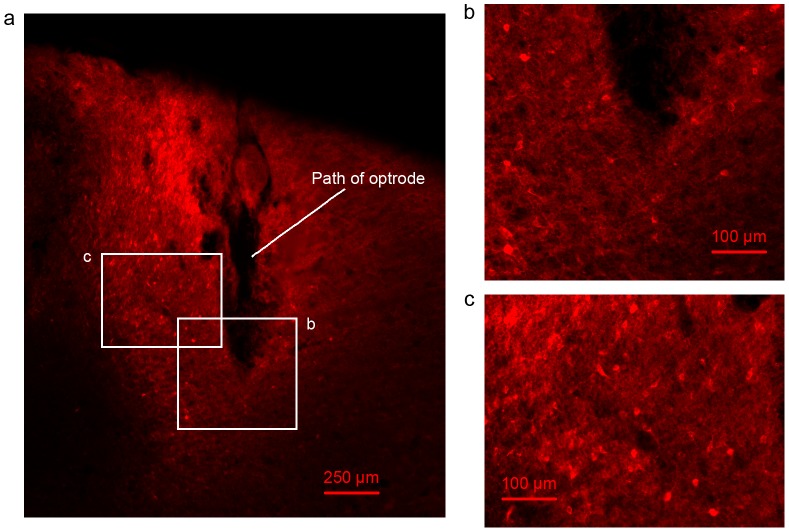
Figure 2. Expression of ChR2.
a. A brain slice under fluorescent microscope with 4X magnification. The damaged region shows the path of the optrode. The bright red region shows the region with ChR2 expression. The bright red spots show the cell bodies with ChR2 expression. b. A region around the tip of optrode under fluorescent microscope with 10X magnification. The region is indicated by the white block b in a. c. A region along the path of the optrode under fluorescent microscope with 10X magnification. The region is indicated by the white block c in a. Cell bodies are clearly seen in b. and c.

