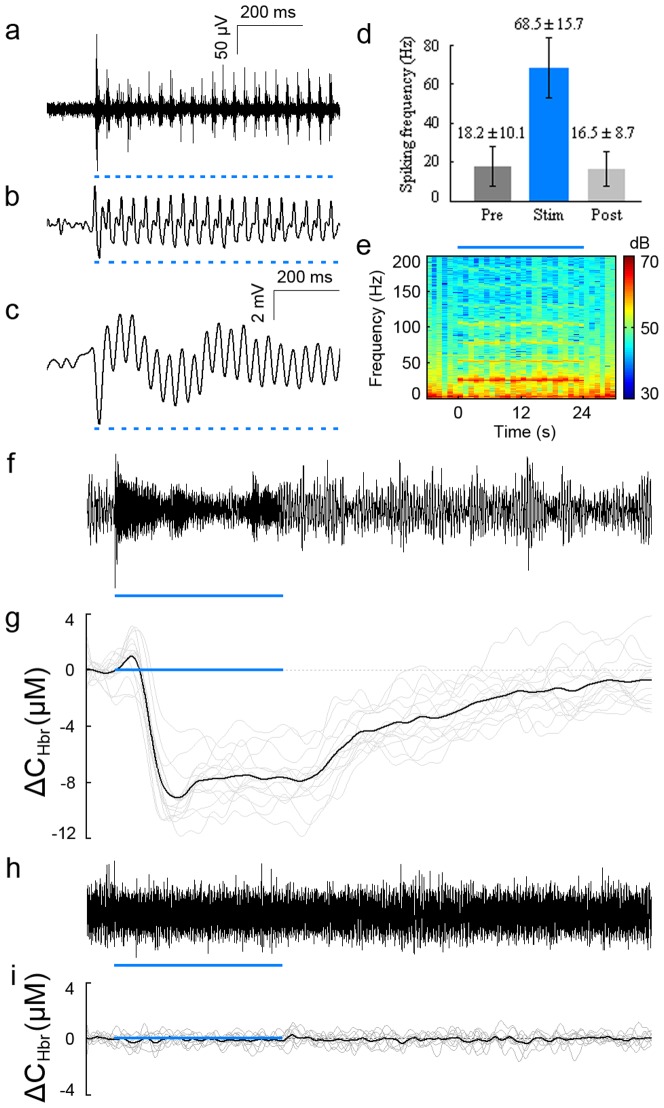
Figure 3. Neural and hemodynamic responses induced by optogenetic stimulation.
a. MUA signal elicited by stimulation of ChR2-expressing pyramidal cells. Pulses of blue light are shown with short blue bars. b. LFP signal in γ band (30∼200 Hz) elicited by stimulation of ChR2-expressing pyramidal cells. c. LFP signal in the spectrum of lower than γ band (0.5∼30 Hz) elicited by stimulation of ChR2-expressing pyramidal cells. d. A significant increase in the firing rate of the MUA signal was observed during stimulation. A threshold of 5 SDs was set to the MUA signal. All spikes above the threshold were counted. e. The spectrum of LFP signal. The frequency range was from 0 to 200 Hz. The stimulating period was indicated by the blue bar. f. The broad-band EEG signal (0.5∼8K Hz) elicited by 24 s stimulation with ChR2 injected in M1. g. Hemodynamic response induced by 24 s stimulation with ChR2 injected in M1. The black line shows the average of 15 trials; the grey lines show hemodynamic responses of all 15 trials. h. The broad-band EEG signal (0.5∼8K Hz) elicited by 24 s stimulation with saline injected in M1. i. Hemodynamic response of control case with saline injected in M1. The black line is the average of 10 trials; grey lines show hemodynamic response of all 10 trials. The stimulating periods are indicated by the blue bars.

