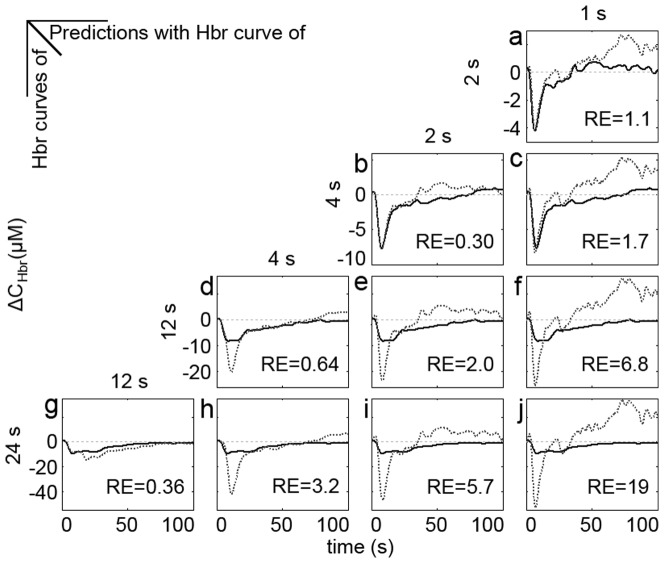
Figure 7. Prediction of Hbr curves with the summing-shifted-replicas method.
a. Prediction of Hbr curve elicited by stimulation of 2 s with Hbr curve elicited by stimulation of 1 s. b–c. Predictions of Hbr curve elicited by stimulation of 4 s with Hbr curves elicited by stimulation of 2 s (b.) and 1 s (c.). d–f. Predictions of Hbr curve elicited by stimulation of 12 s with Hbr curves elicited by 4 s (d.), 2 s (e.) and 1 s (f.). g–j. Predictions of Hbr curve elicited by stimulation of 24 s with Hbr curves elicited by stimuli of 12 s (g.), 4 s (h.), 2 s (i.) and 1 s (j.). Measured and predicted curves are shown in black solid lines and grey dotted lines, respectively. The “RE” in the figures shows the relative error between the predicted and the measured Hbr curves.

