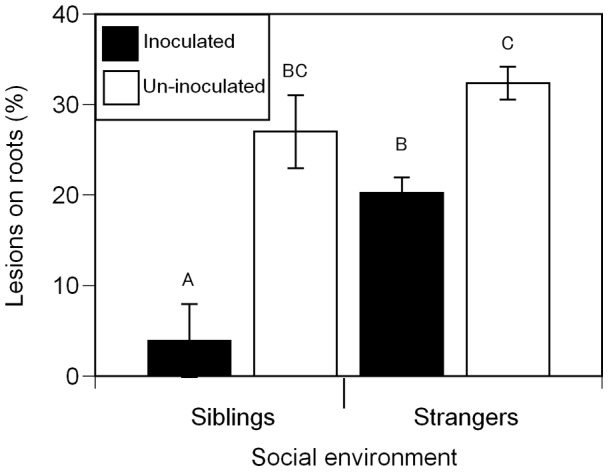
Figure 6. Percent of the root afflicted by lesions in pairs of A. artemisiifolia L seedlings.

Black bars represent plants inoculated with G. intraradices and white bars represent un-inoculated plants (n = 220). Means that did not differ significantly at P<0.05 are represented by the same letter. Error bars represent ±1 s.e.m.
