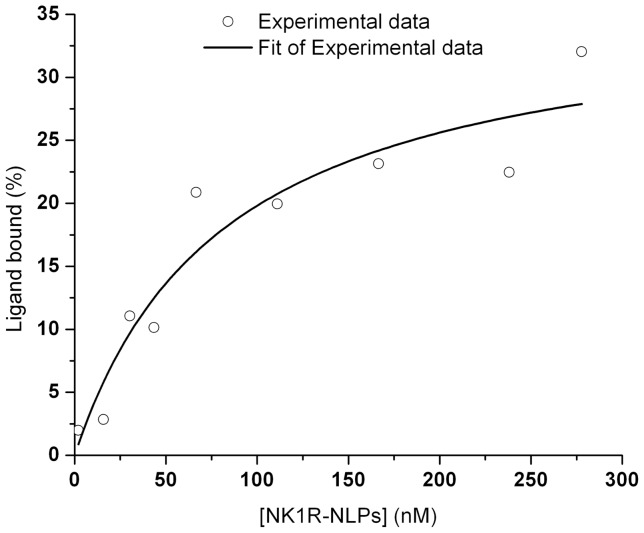
Figure 6. Saturation binding curve of NK1R-NLPs to FAM-SP.
[NK1R-NLPs] is the concentration of free NK1R-NLPs at equilibrium and was calculated from the subtraction of the amount of NK1R-NLPs bound with FAM-SP from the total amount of NK1R-NLPs added. The ligand bound % was calculated by comparing the average diffusion time of the mixture (free FAM-SP and FAM-SP bound with NK1R-NLPs) with the individual controls (diffusion times of free FAM-SP and free NK1R-NLPs). The experimental data (blue dots) were fitted to an “OneSiteBind” model Y = Bmax × X/(Kd + X). Y represents the percentage of bound ligand in the total amount of ligand, and X represents the concentration of NK1R-NLPs in the solution after reaction. The fitting results in 36±5.6 nM for Bmax and 83±33 nM for Kd.

