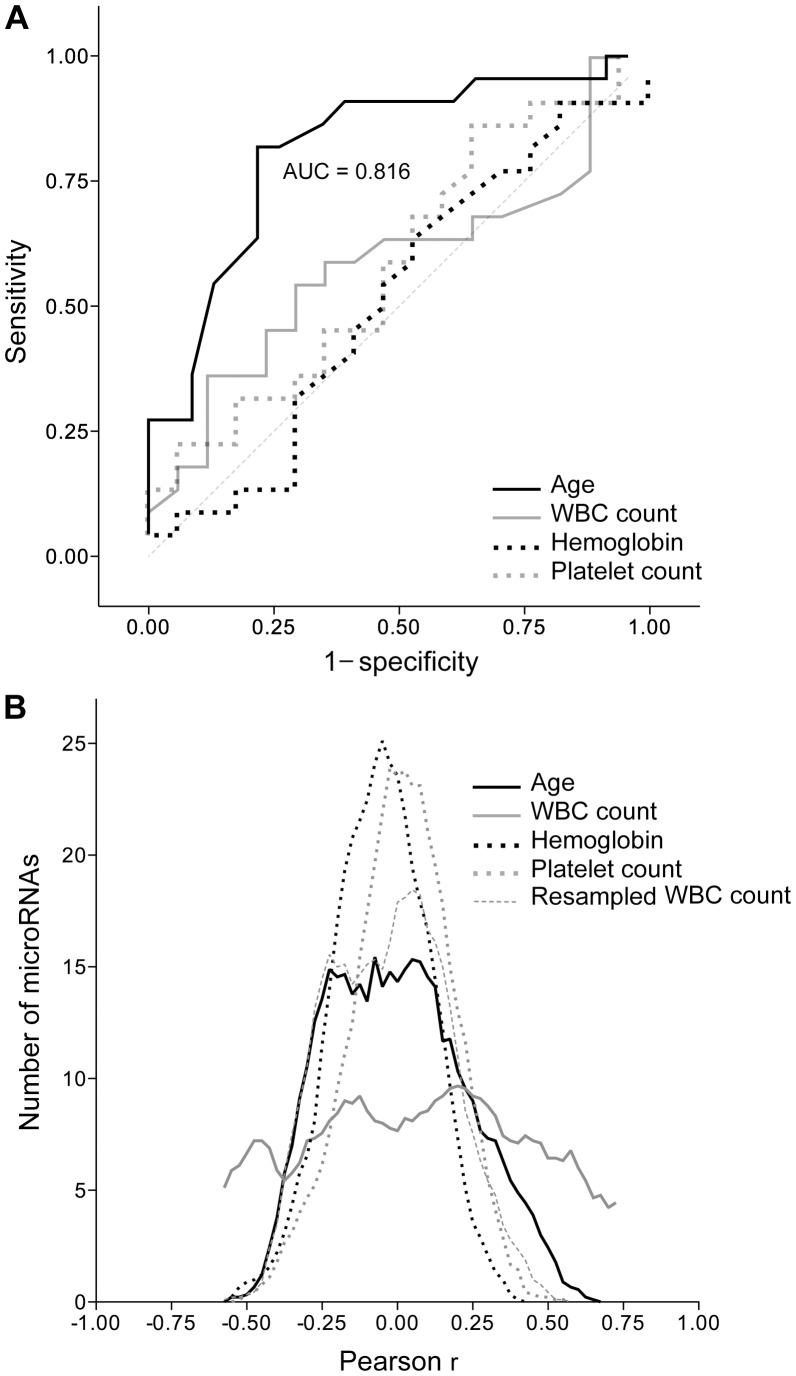
Figure 4. Association with lung adenocarcinoma of age, and blood hemoglobin level, and white blood cell (WBC) and platelet counts.
A. Receiver operating characteristic curves, the areas under curve (AUC) for age, and the line of identity, x = y, with an AUC of 0.5, are shown. B. Correlation with microRNA expression. Values for the clinical variables were correlated with microarray signal values for the 395 expressed microRNAs (n = 45 for age; n = 39 for others). The curves depict frequency histograms of Pearson correlation coefficients (r) with a bin of 0.025. Curves were smoothened using four neighbors for averaging and a zero order polynomial. Correlations are also shown for the random variable resampled WBC count for which values were generated by resampling the WBC count data.

