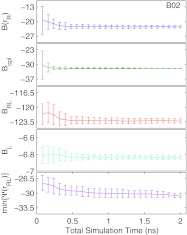
Figure 1.
The mean and standard deviation of 15 independent estimates of B(rR), Bcpl, BRL, BL, and min{Ψ(rRL)} (kcal/mol) based on PBSA energies as a function of total MD simulation time for the ligand B02. Analogous plots for the other ligands in this study are available as Fig. 1 in the supplementary material.37

