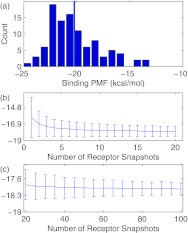
Figure 2.
(a) Histogram of binding PMF estimates (kcal/mol) of B02 to 100 snapshots of CB[7] using PBSA energies. The vertical line shows the mean binding PMF for the minimized receptor structure. (b) and (c) Estimates of the binding free energy ΔG° of B02 to CB[7] (kcal/mol), using PBSA energies, as a function of the number of receptor snapshots. The line and error bars denote the mean and standard deviation from bootstrapping: the binding free energy is estimated 100 times using random selections of N out of 100 binding PMFs. Analogous plots for the other ligands in this study are available as Figs. 2 and 3 in the supplementary material.37

