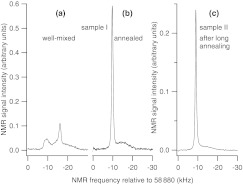
Figure 4.
Averaged 129Xe spectra of fully relaxed samples in thermal equilibrium with the liquid helium bath. (a) Well-mixed sample I at 1.433 K (P0 = 0.0986%). (b) Sample I after the annealing process of Fig. 2a at 1.430 K (P0 = 0.0988%). (c) Sample II after the long annealing process (Fig. 2b) at 1.432 K (P0 = 0.0987%). Note that the very long inherent T1 in the clusters of sample II led to substantial saturation of the narrow peak, despite the use of small flip-angle pulses. For this reason, the peak areas of Fig. 3e could not be converted to polarization.

