
Figure 7.
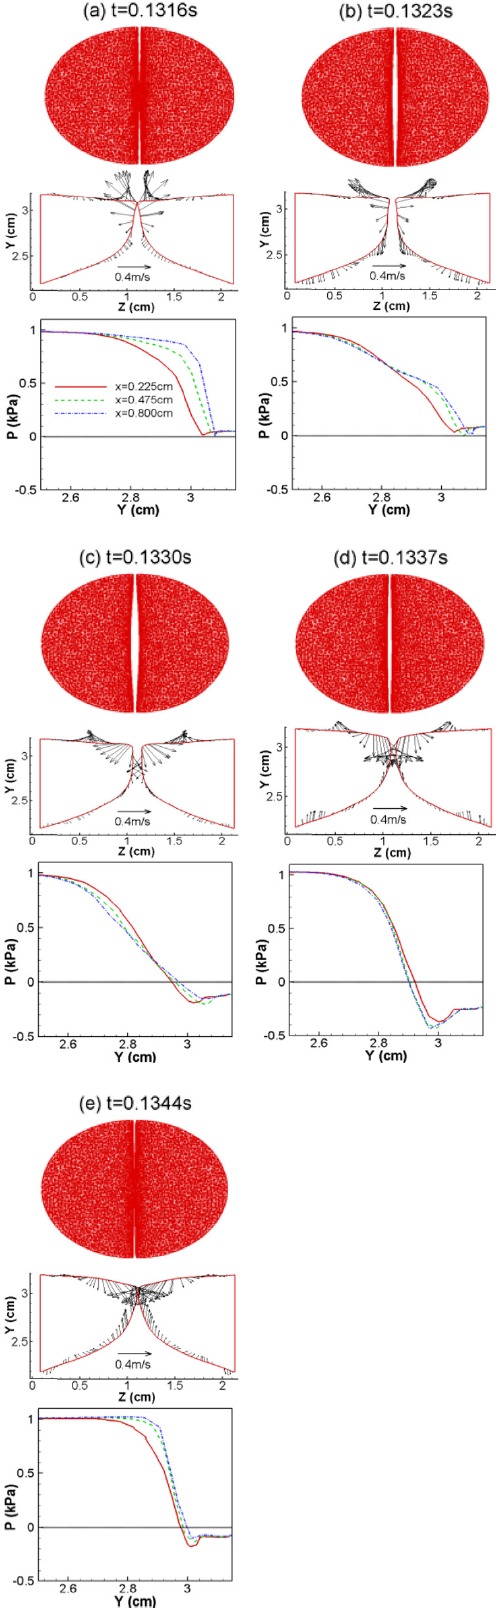
(Color online) Top view of the VF vibration pattern (first row), VF surface velocity (second row), and pressure along one of the VFs (third row) at six time instants over one vibration cycle for the normal (symmetric) model.
Official websites use .gov
A
.gov website belongs to an official
government organization in the United States.
Secure .gov websites use HTTPS
A lock (
) or https:// means you've safely
connected to the .gov website. Share sensitive
information only on official, secure websites.
(Color online) Top view of the VF vibration pattern (first row), VF surface velocity (second row), and pressure along one of the VFs (third row) at six time instants over one vibration cycle for the normal (symmetric) model.