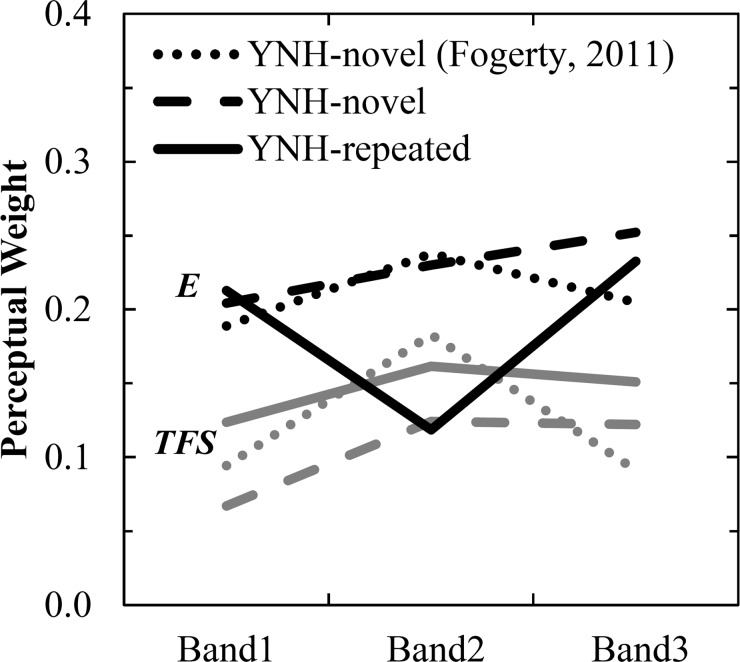
Figure 7.
Comparison of relative perceptual weights for YNH listeners. Black = E weights; Gray = TFS weights. Dotted lines display results for YNH listeners (of comparable age and hearing sensitivity) from Fogerty (2011a) who were tested on 600 novel sentences as a comparison to the novel and repeated sentence testing completed in Experiment 2 using 300 sentences each.

