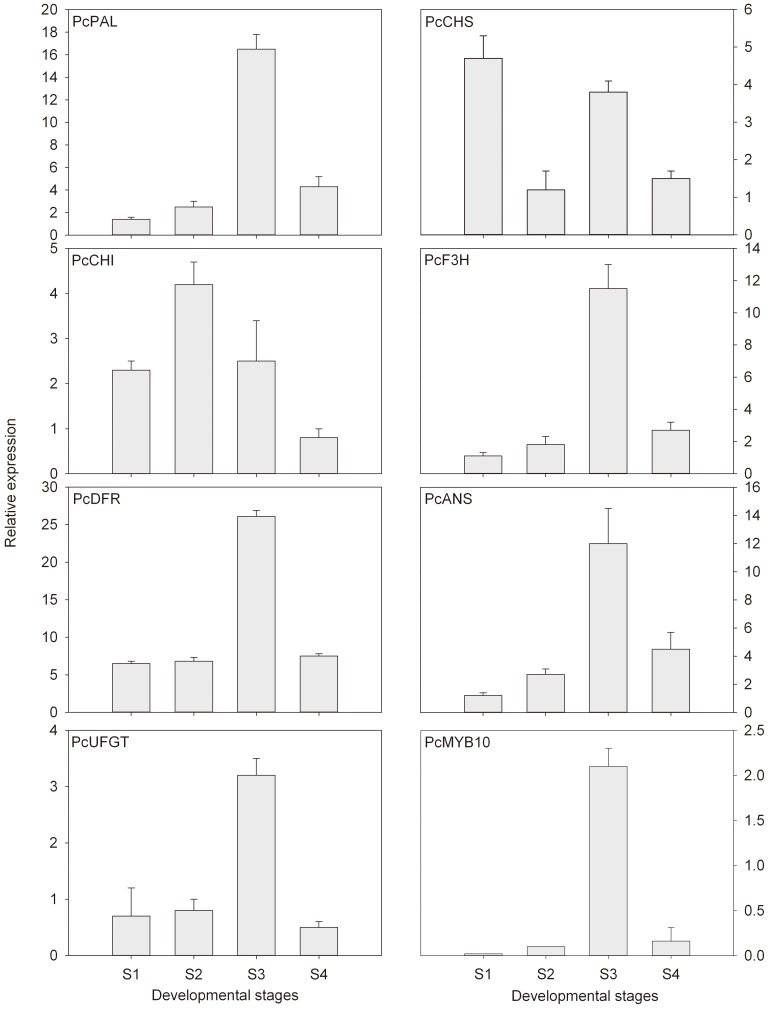
Figure 2. Expression profile of anthocyanin biosynthetic genes during pear ripening.
The relative expression levels of target genes were calculated with formula 2−ΔΔCT. Each point represents the mean value of three independent experiments performed upon sample triplicates ± SE, with each triplicate derived from mRNA samples independently isolated from five fruits.

