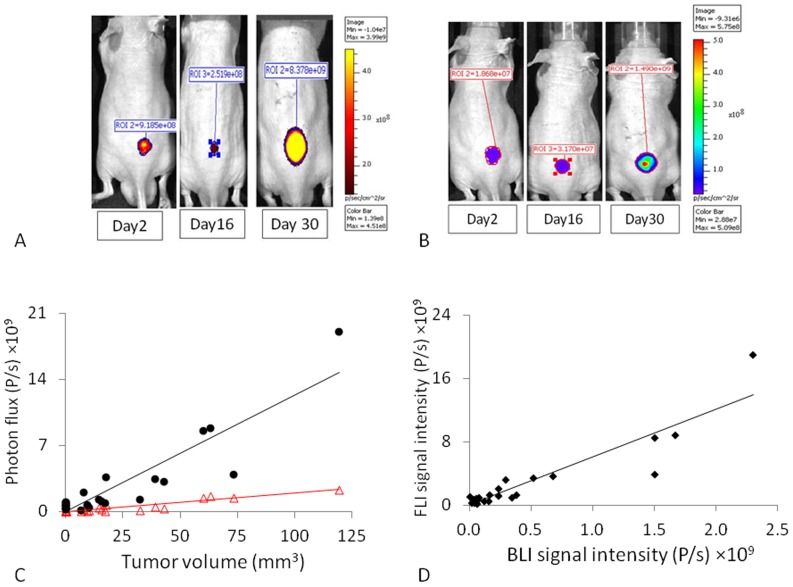
Figure 1. Optical detection of U87-mCherry-luc tumor growth.
A) FLI (λEx = 570 nm and λEm = 620 nm) showed tumor growth on the back of a nude mouse. B) Corresponding BLI acquired 10 mins after administration of sodium D-luciferin (80 µL, 40 mg/ml). C) Correlation between signal intensities and caliper measured tumor volume for a group of six U87-mCherry-Luc tumors; FLI (•; R2>0.82) and BLI (Δ; R2>0.86); D) Correlation between FLI and BLI photon signal intensities at each measurement time (R2>0.86).

