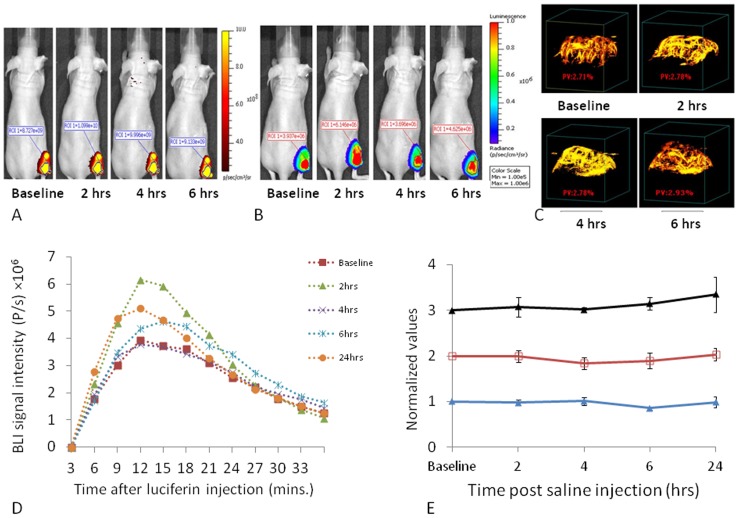
Figure 3. Reproducibility of sequential images in MCF7-mCherry-luc tumors.
A group of nine MCF7-mCherry-luc tumors was repeatedly observed by FLI, BLI, and PD US following injection of 100 µl saline IP. A) Sequential FLI for a representative mouse, B) BLI from the same mouse showing images acquired 10 mins after administration of fresh luciferin on each occasion, c) PD US showing MIP (maximum intensity projection) observed at 40 MHz, D) Variation in dynamic bioluminescent signal intensity from the same tumor as in A,B and C, on five sequential occasions over 24 hrs, E) Comparison of signal stability based on FLI (red □), BLI (blue ▴) and PD-US (black ▴) normalized values are presented mean ± SE for the whole group.

