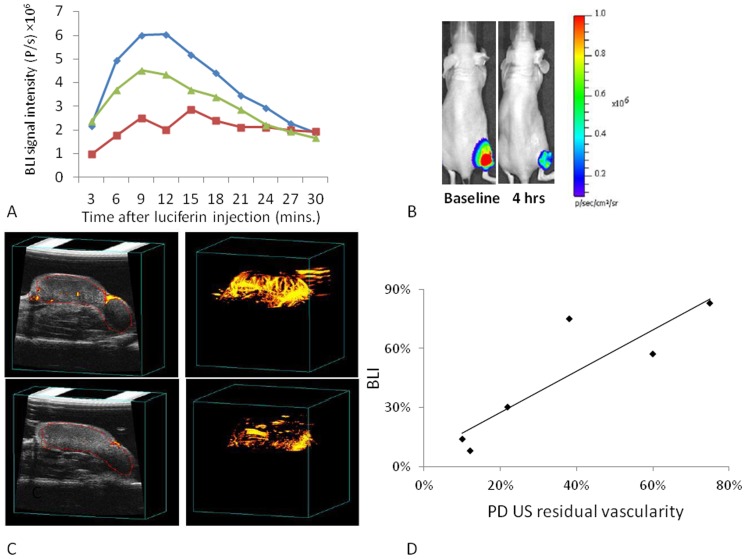
Figure 4. Vascular disruption assessed by BLI and PD-US in MCF7-mCherry-luc tumors with respect to ATO (8 mg/kg).
A) Variation in bioluminescent signal intensity from a representative tumor on sequential occasions over 24 hrs: blue ♦ baseline; red ▪ 4 hrs; green ▴ 24 hrs. B) BLI acquired 10 mins after administration of luciferin. C) PD US images are presented as single slice (left) and PD maximum intensity projection (right) before and 4 hrs after treatment with ATO. D) Comparison of PD US and BLI in MCF7-mCherry-luc tumors as fractional signal versus baseline.

